Tracing all updates to a variable's value: Difference between revisions
Jump to navigation
Jump to search
(Created page with "__TOC__ <span class="f_Para">Another type of tracing is to note all statements that modify a selected variable or data item and what value was assigned to the variable or item...") |
No edit summary |
||
| Line 4: | Line 4: | ||
# <span>Enter a variable or data item name in the Entity name input box below the main window.<br />'''Note:''' Items like global variables or <var>Model 204</var> fields or parameters require the additional prefixes before their names that are described in [[Viewing and modifying program elements|Viewing and modifying program elements.]] </span> | # <span>Enter a variable or data item name in the Entity name input box below the main window.<br />'''Note:''' Items like global variables or <var>Model 204</var> fields or parameters require the additional prefixes before their names that are described in [[Viewing and modifying program elements|Viewing and modifying program elements.]] </span> | ||
# Click the <span class="term">Trace</span> button: | # Click the <span class="term">Trace</span> button: | ||
[[File:tracebut4e_zoom65.gif|305x181px|traceBut4e]] | :: [[File:tracebut4e_zoom65.gif|305x181px|traceBut4e]] | ||
:: The [[traceValues command|traceValues]] [[Introducing the configurable components|mappable]] command and the <span class="term">Trace Values </span>option in the Client's <span class="term">Execution</span> menu have the same effect as the <span class="term">Trace</span> button. | :: The [[traceValues command|traceValues]] [[Introducing the configurable components|mappable]] command and the <span class="term">Trace Values </span>option in the Client's <span class="term">Execution</span> menu have the same effect as the <span class="term">Trace</span> button. | ||
:: The trace continues until one of the events listed in [[Tracing all lines executed|Tracing all lines executed]] occurs. | :: The trace continues until one of the events listed in [[Tracing all lines executed|Tracing all lines executed]] occurs. | ||
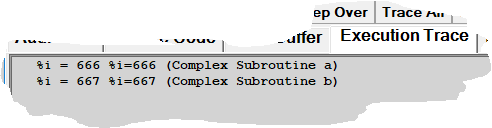
: 3. View the result in the <span class="term">Execution Trace</span> page. | : 3. View the result in the <span class="term">Execution Trace</span> page. | ||
:: Only lines that modified the variable are shown, along with the new value: | :: Only lines that modified the variable are shown, along with the new value: | ||
[[File:valuetrace78.png|492x128px|valueTrace78]] | :: [[File:valuetrace78.png|492x128px|valueTrace78]] | ||
: 4. <span class="f_ListNum1">If tracing was interrupted by a breakpoint or by daemon code, you can continue tracing by clicking the </span><span class="term">Trace </span><span class="f_ListNum1">button again or by pressing the Enter key. </span> | : 4. <span class="f_ListNum1">If tracing was interrupted by a breakpoint or by daemon code, you can continue tracing by clicking the </span><span class="term">Trace </span><span class="f_ListNum1">button again or by pressing the Enter key. </span> | ||
[[Category:Debugger Home]] | [[Category:Debugger Home]] | ||
Latest revision as of 15:00, 25 April 2023
Another type of tracing is to note all statements that modify a selected variable or data item and what value was assigned to the variable or item. To do this:
- Enter a variable or data item name in the Entity name input box below the main window.
Note: Items like global variables or Model 204 fields or parameters require the additional prefixes before their names that are described in Viewing and modifying program elements. - Click the Trace button:
- The traceValues mappable command and the Trace Values option in the Client's Execution menu have the same effect as the Trace button.
- The trace continues until one of the events listed in Tracing all lines executed occurs.
- 3. View the result in the Execution Trace page.
- Only lines that modified the variable are shown, along with the new value:
- 4. If tracing was interrupted by a breakpoint or by daemon code, you can continue tracing by clicking the Trace button again or by pressing the Enter key.

