Debugging the Janus Debugger
Jump to navigation
Jump to search
Whenever your browser sends a web request to a Janus Web Server that has been configured for debugging, this sequence of events unfolds:
- 1. Before sending your web request, the Client on the workstation, which is defined as your proxy server, connects to the Debugger Server port on the online (configured during installation). The Debugger Server starts a thread whose default user ID is SOCKUSER.
- 2. The Debugger Server communicates over a socket connection with the Client and creates a worker thread for this debugging session. The connection handshake contains a unique ID from the Client for this debugging session. The Server worker thread uses AUDIT statements to report its activities to the Model 204 audit trail.
- The following SirScan audit trail lines for user SOCKUSER report the Debugger Server activity described thus far. The session ID is encircled. Subsequent worker thread lines are shown later.
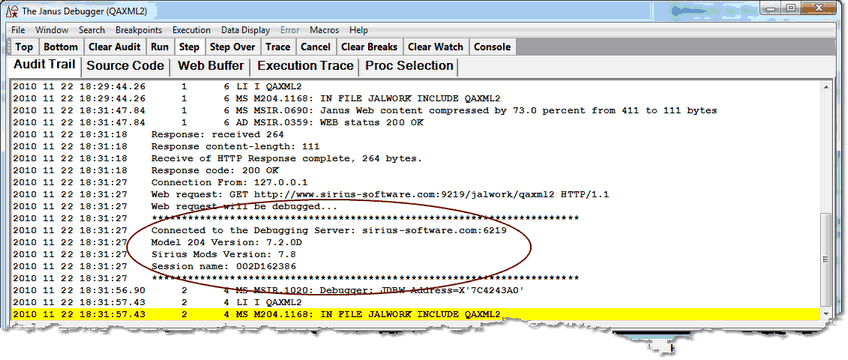
- 3. The worker thread is directed by the Debugger Client (based on user interface actions), and the worker thread maintains an internal master/slave, post/wait relationship with the Web Server thread being debugged. The initial action of the worker thread is to announce itself to the Debugger Client in the Audit Trail page:

- 4. The worker then continues in a loop/dialogue with the Client, reporting its state and latest activity to the Client, and receiving XML requests from the Client (commands that are based on what the Debugger GUI user is invoking). If the normal Web Server response to your web request is to include a Model 204 procedure, for example, the Client sends the worker a command to have the Web Server continue, the worker posts that command to the Web Server, the worker sends AUDIT lines about this exchange, and the worker waits.
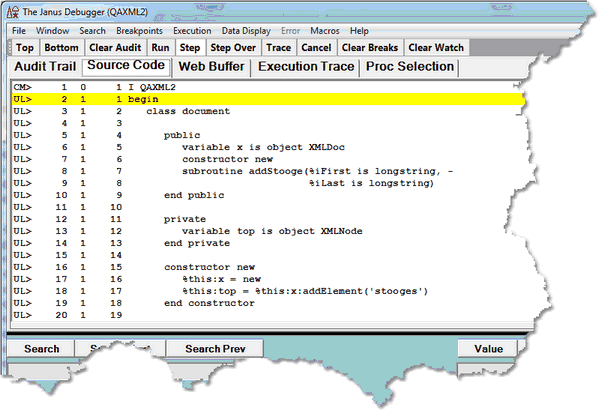
- 5. While the worker thread waits, the Client sends your web request to the Janus Web Server. The worker's wait limit is two minutes, so it will time out and end if the request fails for any reason. Otherwise, the Web Server recognizes the debugging session ID, so sends its response to the worker. In this example, the response is procedure code, which is sent to the worker instead of being run. The worker wakes up, sends the procedure code in an XML document to the Client, and the Client displays the procedure code in the Debugger Source Code page:

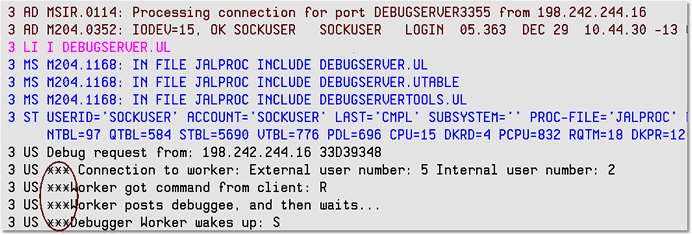
- The worker thread reports its actions thus far in the lines below that begin with three asterisks (***). The worker refers to the Web Server thread as the "debuggee":

- 6. The Client-worker-Web Server communication continues in this fashion according to the commands invoked by the Client GUI user. The Client user initiates the next round of activity by invoking an operation on the source code, say, stepping to the next statement. The Client signals the worker, and the worker instructs the Web Server thread. The worker reports a sequence of audit lines similar to the previous ones (the ending N's below mean "run to Next statement" and "Next statement executed"):

- 7. In case you need to debug the Debugger, you can access the XML traffic exchanged between the worker and Debugger Client. To do so, use the JANUS TRACE command (described in the N) to increase the tracing on the Debugger Server port (in this example, DEBUGSERVER3355), and use SirScan to view the traffic. The JANUS DISPLAYTRACE command reveals the current trace value.
- Since a high tracing value, say 15, can capture huge amounts of data, remember to return the tracing setting to its former value when you no longer need so much detail.
- Also of possible use in a debugging situation, the Debugger Client installation folder is the default location for a text log (log.txt) that includes the Client and workstation browser activity that is captured by the Client.
