Running to a specific procedure
You can direct the Debugger to run an application's code without interruption until it reaches a specific outer, command level, procedure, and then to display that procedure for debugging. The Debugger also stops at procedures that are included from a daemon thread.
For example, you are having a problem with the procedure P.MOE, but the normal flow of the application moves through procedures LARRY, SHEMP, and CURLY prior to P.MOE. The three preceding procedures are known to work fine, and you don't want to interactively debug them.
To run the application normally, executing the preceding procedures, but stopping at P.MOE to begin debugging:
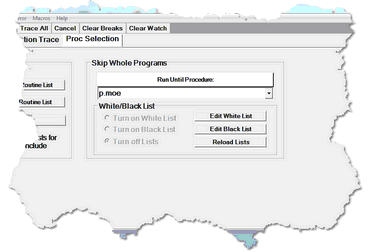
- 1. Beginning with your application program displayed in the Source Code page, select the Proc Selection tab.
- 2. In the text area below the Run Until Procedure button in the Skip Whole Programs area, specify the name of the procedure at which to begin debugging (this input is not case sensitive).
- 3. Click Run Until Procedure.
- The application executes until it reaches the specified procedure, then the Source Code page highlights the first executable User Language statement in that procedure. You are ready to debug.
You can also execute Run Until processing by using:
- The Execution menu Run Until Proc option, which will run immediately, using the procedure name currently specified on the Proc Selection tab
- The mappable Client command runUntil
- A white list, as described in Running only to listed procedures. Run Until for a specific procedure is the same as a white list that contains a single procedure.
Shortcuts for specifying procedure names
Instead of specifying the whole procedure name in the Run Until Procedure text box:
- You may be able to find the name you want by clicking the arrow to the right of the Run Until Procedure text box.
- This reveals a list of the names of as many as the last twenty procedures you entered (for this and from previous sessions). These names are also saved in the until.txt file.
- You can also use leading, trailing, or intermediate wildcards to form a name pattern to stop the Debugger on the first procedure that matches the pattern:
- An asterisk (*) represents any string of characters.
*.M* would stop the code execution at procedure ACC.MOE, or HOME.MARY, or P.MOO., and so on.
- A question mark (?) represents any single character.
?.* matches P.MOO, but not ACC.MOE.
- A double quote (") escapes wildcard translation of the asterisk or question mark that follows it.
?."* matches P.*, but not P.MOO.
Note: The Model 204 LAUDPROC (Length of Audit Procedure Names) User 0 parameter (default: 21) must be set to the size of the largest procedure name that will be filtered. Otherwise, name matching is done against truncated procedure names.
Precedence and scope for Run Until
As described for the Break method, the "run until" processing takes precedence over any Break method calls that may be present in your procedures. Run Until ignores such calls.
Run Until also continues without interruption past any persistent session suspend/resume sequences.
The default boundaries beyond which Run Until does not continue processing are these:
- The end of the debugging session
- Once a session ends, either normally or through a lost connection, and Run Until searching is interrupted before it finds a specified procedure, a restarted Client does not automatically resume its search.
- The end of an HTTP request (Janus Debugger)
- If the current HTTP transaction completes and the Debugger does not encounter the target procedure, it does not continue its search for the target into subsequent HTTP requests. This is ordinarily not an issue.
It may be the case, however, that you want the Debugger not to respect these boundaries. You do not want to have to repeatedly invoke Run Until for the same procedure. For example, you are working with HTML frames, where each frame and frameset is a separate HTTP transmission to the browser, and you want Run Until to span all these HTTP requests rather than stopping for each frame that involves User Language.
To change the span of Run Until:
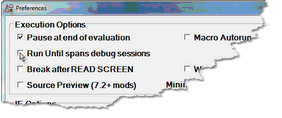
- In the Client, select Preferences from the File menu (or use the CTRL-P keyboard shortcut).
- n the Preferences dialog box, select the Run Until spans debug sessions checkbox (which is clear by default), then click Done.
Now, with a single invocation of Run Until, you can be sure to display the procedure you want. If, for example, the TN3270 Debugger was turned off and then on again, the Client will resume an incompleted Run Until search. Or in the case where you are debugging a request that satisfies an individual frame or frameset, the Client will continue (with no other execution breaks) through the code for subsequent frames until it finds the specified procedure.
This setting takes effect immediately, and it persists over multiple runs of the Client.
Interrupting Run Until processing
Run Until processing is interruptible: the command breakOnNextProc lets you override a Run Until to interactively debug the next included procedure.
To use a manual interrupt for Run Until processing:
- Map the breakOnNextProc command to a Client button or hot key (as described in Setting up the ui.xml file) or in a macro (as described in Using Debugger macros).
- While debugging an application where Run Until processing is active, invoke the button or hot key or macro.
"Break on next proc set" displays in the Status bar to indicate the command has been successfully issued, and the next procedure included at command level (or from APSY) will be debugged, even if the Run Until would normally ignore it.
In the same way you interrupt Run Until processing, you can also interrupt White List procedure processing.
See Also

