SirMon User Monitor menu: Difference between revisions
m (1 revision: SirMon pages) |
(Automatically generated page update) |
||
| (5 intermediate revisions by one other user not shown) | |||
| Line 1: | Line 1: | ||
Option 3 from the <var class="product">SirMon</var> main menu presents a menu of user statistics screens. | Option 3 from the <var class="product">SirMon</var> main menu presents a menu of user statistics screens. | ||
This menu is also accessible by entering <code>=3</code> in the command | This menu is also accessible by entering <code>=3</code> in the command | ||
line of any <var class="product">SirMon</var> screen. | line of any <var class="product">SirMon</var> screen. In [[RKWeb]], expanding the <code>Performance > Users</code> menu of the <code>Monitor</code> tab displays these statistics options in a sub-menu. | ||
<p class="caption" style="width:475px">User Monitor menu</p> | |||
" | <p class="figure">[[File:SmonUserMon.png|475px]]</p> | ||
Selecting any user statistics option from this menu transfers opens a | |||
[[SirMon application structure#Scrollable screen format|scrollable screen]] displaying specific statistics for all users in the Online system. The PF1 key displays definitions for the presented statistics. | |||
<table class="thJustBold"> | <table class="thJustBold"> | ||
<tr><th nowrap> | <tr class="head"><th>Number</th> | ||
<th>Option</th> | |||
<th>Description</th></tr> | |||
<tr><th>U </th> | |||
<th nowrap>Update the selection menu</th> | |||
<td>Allows <var class="product">SirMon</var> administrators to customize the User Monitor menu.</td></tr> | <td>Allows <var class="product">SirMon</var> administrators to customize the User Monitor menu.</td></tr> | ||
<tr><th> | <tr><th>A </th> | ||
<td>An | <th>User AD-HOC</th> | ||
<td>An ad hoc view of user statistics specific to each <var class="product">SirMon</var> user.</td></tr> | |||
<tr><th> | <tr><th>1 </th> | ||
<th>Resource Usage</th> | |||
<td>Broad measurements of users' consumption of CPU and I/O activity.</td></tr> | <td>Broad measurements of users' consumption of CPU and I/O activity.</td></tr> | ||
<tr><th> | <tr><th>2 </th> | ||
<th>User State Display</th> | |||
<td>Displays users state, wait type and other measures to indicate their level of activity.</td></tr> | <td>Displays users state, wait type and other measures to indicate their level of activity.</td></tr> | ||
<tr><th>3 | <tr><th>3 </th> | ||
<th>Resource Usage and Subsys</th> | |||
<td>Various resource consumption statistics and the current subsystem for each user.</td></tr> | <td>Various resource consumption statistics and the current subsystem for each user.</td></tr> | ||
<tr><th> | <tr><th>4 </th> | ||
<th>Disk Buffer Usage</th> | |||
<td>Various DKxxx statistics for each user.</td></tr> | <td>Various DKxxx statistics for each user.</td></tr> | ||
<tr><th> | <tr><th>5 </th> | ||
<th>Misc. Resource Usage</th> | |||
<td>Aggregate measures of activity, making it easy to spot significant resource consumers.</td></tr> | <td>Aggregate measures of activity, making it easy to spot significant resource consumers.</td></tr> | ||
<tr><th nowrap> | <tr><th nowrap>6 </th> | ||
<th>Record Locking Table Usage</th> | |||
<td>Statistics useful in determining utilization of the record locking table and highlighting poor enqueueing behaviour in applications.</td></tr> | <td>Statistics useful in determining utilization of the record locking table and highlighting poor enqueueing behaviour in applications.</td></tr> | ||
<tr><th> | <tr><th>7 </th> | ||
<th>Critical File Resources</th> | |||
<td>Detailed statistics providing information about conflicts on critical file resources.</td></tr> | <td>Detailed statistics providing information about conflicts on critical file resources.</td></tr> | ||
</table> | </table> | ||
| Line 48: | Line 55: | ||
These screens are defined by a <var class="product">SirMon</var> administrator as described in [[SirMon custom screens]]. | These screens are defined by a <var class="product">SirMon</var> administrator as described in [[SirMon custom screens]]. | ||
A number of special commands allow screen positioning and selection | ==User Monitor commands== | ||
when viewing user statistics. | A number of special commands (TN3270 interface only) allow screen positioning and selection when viewing user statistics. | ||
<table class="thJustBold"> | <table class="thJustBold"> | ||
| Line 99: | Line 106: | ||
</table> | </table> | ||
All User Monitor screens give the option of | ==Zoom and Detail views== | ||
All User Monitor screens give the option of "zooming" (the PF6 key) | |||
or obtaining a detail view (the PF10 key) on an individual user. | or obtaining a detail view (the PF10 key) on an individual user. | ||
The cursor must be on a valid | The cursor must be on a valid user line to determine the user for | ||
which | which Zoom or Detail statistics are required. In RKWeb, clicking a line of statistics opens a combined Zoom and Detail view. | ||
Zoom presents a non-scrollable (refer to [[SirMon application structure#Non-scrollable screen format|Non-scrollable screen format]]) | |||
screen displaying the same statistics that were displayed on the original screen, | screen displaying the same statistics that were displayed on the original screen, | ||
but with screen lines representing time-sliced views of the selected | but with screen lines representing time-sliced views of the selected | ||
user's performance. | user's performance. | ||
Detail presents a display of most of the important statistics that | |||
can be displayed for any single user: | can be displayed for any single user: | ||
<p class="caption" style="width: | <p class="caption" style="width:475px">User Detail screen</p> | ||
<p class="figure">[[File:SmonUserDetail.png| | <p class="figure">[[File:SmonUserDetail.png|475px]]</p> | ||
The PF3 key from a | The PF3 key from a Zoom or Detail screen returns the original User Monitor screen. | ||
original User Monitor screen. | |||
==See also== | ==See also== | ||
Latest revision as of 21:50, 6 June 2017
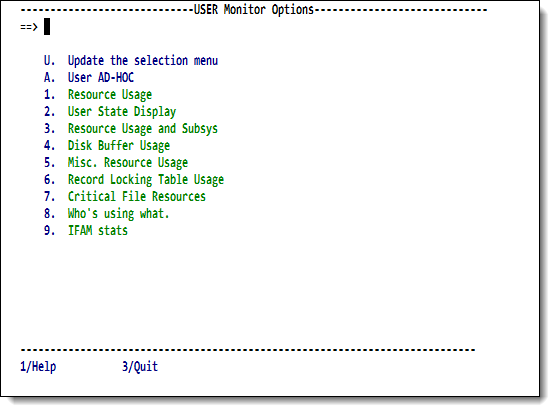
Option 3 from the SirMon main menu presents a menu of user statistics screens.
This menu is also accessible by entering =3 in the command
line of any SirMon screen. In RKWeb, expanding the Performance > Users menu of the Monitor tab displays these statistics options in a sub-menu.
User Monitor menu
Selecting any user statistics option from this menu transfers opens a scrollable screen displaying specific statistics for all users in the Online system. The PF1 key displays definitions for the presented statistics.
| Number | Option | Description |
|---|---|---|
| U | Update the selection menu | Allows SirMon administrators to customize the User Monitor menu. |
| A | User AD-HOC | An ad hoc view of user statistics specific to each SirMon user. |
| 1 | Resource Usage | Broad measurements of users' consumption of CPU and I/O activity. |
| 2 | User State Display | Displays users state, wait type and other measures to indicate their level of activity. |
| 3 | Resource Usage and Subsys | Various resource consumption statistics and the current subsystem for each user. |
| 4 | Disk Buffer Usage | Various DKxxx statistics for each user. |
| 5 | Misc. Resource Usage | Aggregate measures of activity, making it easy to spot significant resource consumers. |
| 6 | Record Locking Table Usage | Statistics useful in determining utilization of the record locking table and highlighting poor enqueueing behaviour in applications. |
| 7 | Critical File Resources | Detailed statistics providing information about conflicts on critical file resources. |
As many as 25 locally defined screens may also be accessed from the User Monitor menu. These screens are defined by a SirMon administrator as described in SirMon custom screens.
User Monitor commands
A number of special commands (TN3270 interface only) allow screen positioning and selection when viewing user statistics.
| NO xxxxx | Positions the screen at the specified user number. |
|---|---|
| ACCOUNT xxxxxxx | xxxxxxxx is any valid wildcard string.
This restricts the display to users with account ids that match the specified pattern. For example, this command limits the display to account IDs that begin with the letters "AB": ACCOUNT AB* |
| CHKP | Restricts the display to users that have an inflight updating transaction, hence preventing checkpoints. A checkpoint does not have to be in progress for this option to perform the indicated restriction, but if nobody is holding an open updating transaction, the display will be empty. |
| FILE xxxxxxxx | Restricts the display to users that have file xxxxxxxx open. Wildcards may not be used in the file name. |
| IODEV xxx | Restricts the display to users connected to the Model 204 online via the specified IO device type. Wildcards are not allowed in the IODEV specification. |
| PNAME xxxxxxxx | This restricts the display to users currently running any procedure whose name matches the specified pattern. For example, this command limits the display to users running any procedure whose name ends with the letters "MENU":
PNAME *MENU |
| SUBSYS xxxxxxxx | This restricts the display to users in any subsystem that matches the specified pattern.
For example, this command limits the display to users in any subsystem that begins with the letters "TEST": SUBSYS TEST* |
| TERMID xxxxxxx | This restricts the display to users with terminal ids that match the specified pattern. For example, this command limits the display to terminal ids that begin with the letters "VT":
TERMID VT* |
| USER xxxxxxxx | This restricts the display to user ids that match the specified pattern.
For example, this command limits the display to user ids that begin with the letters "PROC": USER PROC* |
| WHAT xxxx | This restricts the display to users whose WHAT statistic matches the specified pattern. For example, this command limits the display to users with WHAT statistics that begin with the letters "EV", hence only EVAL users would be shown:
WHAT EV* |
| ALL | ALL removes any restriction on the display. The display is returned to viewing all users. |
Zoom and Detail views
All User Monitor screens give the option of "zooming" (the PF6 key) or obtaining a detail view (the PF10 key) on an individual user. The cursor must be on a valid user line to determine the user for which Zoom or Detail statistics are required. In RKWeb, clicking a line of statistics opens a combined Zoom and Detail view.
Zoom presents a non-scrollable (refer to Non-scrollable screen format) screen displaying the same statistics that were displayed on the original screen, but with screen lines representing time-sliced views of the selected user's performance.
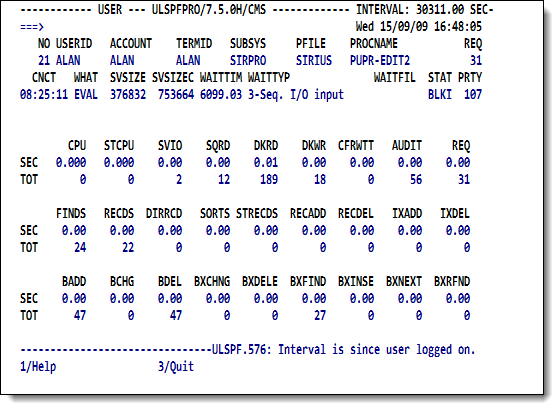
Detail presents a display of most of the important statistics that can be displayed for any single user:
User Detail screen
The PF3 key from a Zoom or Detail screen returns the original User Monitor screen.
See also
- SirMon
- SirMon application structure
- SirMon main menu
- SirMon System Overview screen
- SirMon threshold setting
- SirMon background monitor
- SirMon System Monitor menu
- SirMon User Monitor menu
- SirMon File Monitor menu
- SirMon Subsystem Monitor menu
- SirMon Task Monitor menu
- SirMon Janus Monitor menu
- SirMon custom screens
- SirMon critical-file-resource monitoring
- SirMon user-initiated capturing of statistics
- System statistics displayed in SirMon
- User statistics displayed in SirMon
- File statistics displayed in SirMon
- Subsystem statistics displayed in SirMon
- Task statistics displayed in SirMon
- Critical File Resource statistics displayed in SirMon
- SirMon date processing

