Introduction to SoftSpy: Difference between revisions
m resize graphics |
m resize graphics |
||
| (18 intermediate revisions by one other user not shown) | |||
| Line 127: | Line 127: | ||
</ul> | </ul> | ||
===AUDIT option === | ===AUDIT option=== | ||
<p> | <p> | ||
Debugging run-time errors in User | Debugging run-time errors in User | ||
| Line 149: | Line 149: | ||
<p class="caption" style="width:640px">Audit trail with divide by zero error and SoftSpy audit information</p> | <p class="caption" style="width:640px">Audit trail with divide by zero error and SoftSpy audit information</p> | ||
<p class="figure | <p class="figure">[[File:SoftSpy_intro_divide_by_zero.png|640px]]</p> | ||
<p>The sample screen below shows the program that caused the | <p>The sample screen below shows the program that caused the | ||
| Line 189: | Line 189: | ||
<p>The current line (indicated by => in the prefix area) is positioned on the line that caused the error. The values of variables at the time of the error are displayed in the monitor window.</p> | <p>The current line (indicated by => in the prefix area) is positioned on the line that caused the error. The values of variables at the time of the error are displayed in the monitor window.</p> | ||
<p class="caption">Interception of a divide by zero error</p> | <p class="caption" style="width:550px">Interception of a divide by zero error</p> | ||
<p | <p class="figure">[[File:SoftSpy_intro_intercept_div_by_zero.png]] </p> | ||
<p>If you need additional information, you can easily examine | <p>If you need additional information, you can easily examine | ||
| Line 224: | Line 201: | ||
<p>The current line is positioned on the first line that contains a syntax error. Function keys are provided to jump forward to the next line containing an error or backward to the previous error line.</p> | <p>The current line is positioned on the first line that contains a syntax error. Function keys are provided to jump forward to the next line containing an error or backward to the previous error line.</p> | ||
<p class="caption" style="width: | <p class="caption" style="width:620px">Interception of compilation errors</p> | ||
<p | <p class="figure">[[File:SoftSpy_intro_intercept_comp_err.png|620px]]</p> | ||
====Application understanding==== | ====Application understanding==== | ||
| Line 301: | Line 256: | ||
<p>The column labeled "U" contains the letter "U" for each line with an untested executable statement. If an executable statement has been tested then the column labeled "TIMES TESTED" indicates the number of times it was executed.</p> | <p>The column labeled "U" contains the letter "U" for each line with an untested executable statement. If an executable statement has been tested then the column labeled "TIMES TESTED" indicates the number of times it was executed.</p> | ||
<p class="caption" style="width: | <p class="caption" style="width:620px">Quality Assurance test coverage profile</p> | ||
<p | <p class="figure">[[File:SoftSpy_intro_QA_test_cov.png|620px]] </p> | ||
<p>Function keys are provided to allow you to move forward and backward among untested statements. You can also print the test coverage profile for review at a later time.</p> | <p>Function keys are provided to allow you to move forward and backward among untested statements. You can also print the test coverage profile for review at a later time.</p> | ||
| Line 335: | Line 268: | ||
<p>The column labeled "R" indicates whether an executable statement is reachable or unreachable.</p> | <p>The column labeled "R" indicates whether an executable statement is reachable or unreachable.</p> | ||
<p class="caption" style="width: | <p class="caption" style="width:620px">Unreachable statements</p> | ||
<p | <p class="figure">[[File:SoftSpy_intro_unreachable_statements.png|620px]] </p> | ||
====Option features==== | ====Option features==== | ||
| Line 401: | Line 312: | ||
This type of performance profile shows statements with excessive CPU consumption. It also shows statements that generate excessive page requests. Excessive page requests pinpoint performance-related problems such as the thrashing of images in and out of the buffer pool. This detailed information can explain the cause of a CPU or I/O bottleneck. | This type of performance profile shows statements with excessive CPU consumption. It also shows statements that generate excessive page requests. Excessive page requests pinpoint performance-related problems such as the thrashing of images in and out of the buffer pool. This detailed information can explain the cause of a CPU or I/O bottleneck. | ||
<p class="caption" style="width: | <p class="caption" style="width:620px">Performance Profile</p> | ||
<p class=" | <p class="figure">[[File:SoftSpy_intro_perf_profile.png|620px]] </p> | ||
===CCATEMP usage=== | ===CCATEMP usage=== | ||
<p>In addition to all normal statistics, SoftSpy can show CCATEMP use by line. The use of CCATEMP is a critical performance factor. Excessive use causes buffer pool thrashing that becomes much worse as overall system load increases. Monitoring CCATEMP use lets you see the real problem, even on a lightly loaded system.</p> | <p>In addition to all normal statistics, SoftSpy can show CCATEMP use by line. The use of CCATEMP is a critical performance factor. Excessive use causes buffer pool thrashing that becomes much worse as overall system load increases. Monitoring CCATEMP use lets you see the real problem, even on a lightly loaded system.</p> | ||
<p class="caption" style="width: | <p class="caption" style="width:620px">Performance profile with CCATEMP use and histograms</p> | ||
<p | <p class="figure">[[File:SoftSpy_intro_perf_profile_CCATEMP.png|620px]] </p> | ||
===Server table usage=== | ===Server table usage=== | ||
| Line 459: | Line 325: | ||
<p>SoftSpy can show detailed statement level usage of server tables. Cumulative server table use can be shown for all server tables, and individually for tables such as QTBL and VTBL. This line by line information allows you to understand and optimize an application's server table use.</p> | <p>SoftSpy can show detailed statement level usage of server tables. Cumulative server table use can be shown for all server tables, and individually for tables such as QTBL and VTBL. This line by line information allows you to understand and optimize an application's server table use.</p> | ||
<p class="caption" style="width: | <p class="caption" style="width:635px">Server table usage profile</p> | ||
<p | <p class="figure">[[File:SoftSpy_intro_server_table_usage.png|620px]]</p> | ||
===Performance information=== | ===Performance information=== | ||
| Line 521: | Line 364: | ||
<td><var class="term">placeholder</var></td> <td>Placeholders for substituted text, or the names of placeholders, are shown in lowercase italic.</td></tr> | <td><var class="term">placeholder</var></td> <td>Placeholders for substituted text, or the names of placeholders, are shown in lowercase italic.</td></tr> | ||
<tr> | <tr> | ||
<td>[ OPTIONAL ]</td> <td>Optional items are enclosed in square brackets.</td></tr> | <td nowrap>[ OPTIONAL ]</td> <td>Optional items are enclosed in square brackets.</td></tr> | ||
<tr> | <tr> | ||
<td><p>{ REQUIRED } </p> | <td nowrap><p>{ REQUIRED } </p> | ||
REQUIRED</td> <td>Required items are either enclosed in braces or are not enclosed in either square brackets or braces.</td></tr> | REQUIRED</td> <td>Required items are either enclosed in braces or are not enclosed in either square brackets or braces.</td></tr> | ||
<tr> | <tr> | ||
Latest revision as of 16:42, 25 February 2016
SoftSpy is a comprehensive system that allows the dynamic execution and collection of information concerning all aspects of User Language requests. It provides the information you need to quickly debug applications, learn how they operate, perform thorough quality assurance testing, identify and eliminate performance bottlenecks, and learn the general underlying principles behind good performance.
The heart of SoftSpy is a highly efficient kernel that gathers detailed statement level data in real-time while your application runs. You can interactively examine this data to obtain exactly the information you need.
An overview of SoftSpy follows. For more documentation on installing and using SoftSpy, see the SoftSpy category.
Interactive debugging
SoftSpy debugging provides the detailed information required to quickly and efficiently pinpoint the precise cause of a problem. It shows the exact statement causing a run-time error, the values of all program variables and data, and the history of statements executed prior to the error.
Application understanding
Understanding how an application works requires that you run the application to learn the user interface. It also requires that you study the procedures and data used by the application.
SoftSpy lets you quickly learn how applications work by integrating these activities together. You can clearly see which procedures are responsible for which portions of the user interface, and you can watch the interaction between the program and the data.
Quality Assurance testing
SoftSpy enables you to systematically test your applications. It shows you which statements have been tested and which statements have not been tested. SoftSpy also determines if untested code is really dead code (for example, code that is branched around or subroutines that are not called). This information lets you know if there are significant gaps in your testing effort. SoftSpy also lets you alter the flow of control in an executing program so you can more easily test all code paths.
Performance tuning
SoftSpy shows detailed performance characteristics of individual statements within User Language requests. Consumption of resources such as CPU time, page reads, disk reads and writes, CCATEMP, and server tables are all available on a statement by statement basis. Total use, percentages, or averages can be displayed, and histograms can show relative use graphically.
Education
SoftSpy can easily display performance information during normal testing of User Language requests. It is easy to observe how well a chosen approach works, which helps in learning the most efficient way to work with Model 204.
SoftSpy components
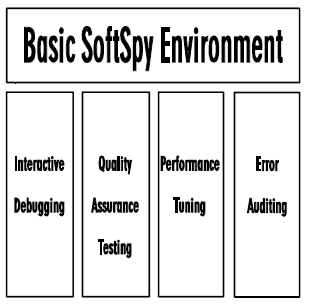
SoftSpy consists of four distinct optional components that share a common basic environment. The components are shown in the following figure.
SoftSpy components
Each component provides comprehensive capabilities in the indicated area.
- The Interactive Debugging option provides facilities for interactively debugging applications and for understanding how applications work.
- The Quality Assurance option supports QA testing.
- The Performance Tuning option supports both performance tuning and the education of users in performance factors.
- The Error Auditing option provides facilities to audit and diagnose errors that occur when a SoftSpy session is not active.
Basic SoftSpy environment
The basic SoftSpy environment provides many capabilities that are shared by all SoftSpy options.
Basic SoftSpy commands
Commands to perform the following functions are provided with all options.
- Turn SoftSpy on and off.
- Interactively execute a User Language request statement by statement.
- Execute an application until a user specified condition occurs, or until an interrupt such as an error occurs.
- Set and clear break points that will interrupt request evaluation when they are encountered.
- View the source code of the currently executing request (with all includes expanded) using a comprehensive set of scrolling commands.
- Define and manipulate windows that display information to be monitored on an ongoing basis.
- Add columns to the source code display that show detailed statement by statement information.
- Produce printed reports containing any information that can be displayed to the terminal.
- Assign frequently used commands to program function keys.
- Tailor the product by defining new commands using a powerful macro definition facility.
- Obtain help using a context-sensitive online facility.
- Configure the SoftSpy environment and define privileges of users.
SoftSpy data
SoftSpy provides access to a large variety of data. Access to most data is based on whether the optional feature that provides it is available. However, the following generic information is provided with all options:
- The name of the current subsystem.
- The name of the procedure and the procedure file containing the current request.
- The number of source lines in the current request, and the text, include level, nesting level, and line type of each line.
- A graphic representation of both the nesting and include levels.
- The current line being executed.
- Whether an update is in progress.
- Model 204 parameter values.
AUDIT option
Debugging run-time errors in User Language requests in a production environment can be a frustrating and time-consuming process.
The SoftSpy Audit option provides the detailed information required to debug run-time errors in User Language requests and quickly and efficiently pinpoint the cause of the problem.
Run-time errors
With the SoftSpy Audit feature enabled in your production environment, additional audit messages are produced when an error occurs during the evaluation of a User Language request. These messages identify the exact location that the error occurred within the request. Using this information in conjunction with the SoftSpy Audit environment you are quickly able to locate the statement causing the problem.
The sample below shows a segment of a Model 204 audit trail containing a typical divide by zero run-time error with the additional SoftSpy Audit information.
Audit trail with divide by zero error and SoftSpy audit information
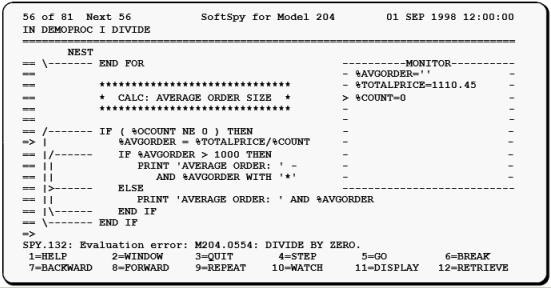
The sample screen below shows the program that caused the
divide by zero error above using the SoftSpy Audit environment.
In the Audit
environment you can quickly identify the statement that caused the problem.
Audit environment showing line causing divide by zero error
Option features
The audit error option provides a number of features that augment the basic SoftSpy environment to provide a robust run-time error debugging environment.
Commands
- Establish the interactive audit error environment.
- Enable and disable auditing additional debugging information when SoftSpy is not in use.
- Display the User Language line causing a run-time error by utilizing SoftSpy audit information.
SoftSpy data
Information about the following types of operands is provided:
- Quad offset of the statement causing a run-time error.
DEBUG option
The DEBUG option provides the detailed information required to debug User Language requests and quickly and efficiently pinpoint the cause of a problem.
Run-time errors
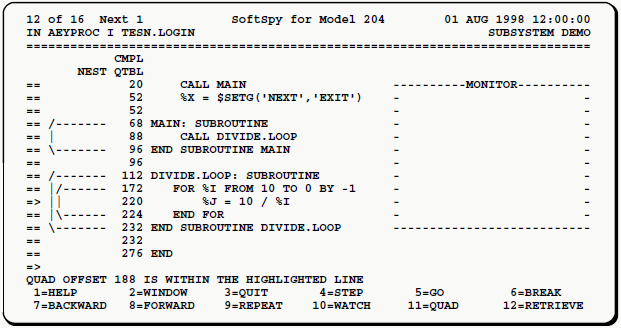
SoftSpy lets you quickly track down run-time errors. After intercepting a typical error like divide by zero, SoftSpy displays a detailed diagnostic screen.
The name of the request being evaluated is shown on the second line of the screen followed by a window into the complete request with all includes expanded.
The current line (indicated by => in the prefix area) is positioned on the line that caused the error. The values of variables at the time of the error are displayed in the monitor window.
Interception of a divide by zero error
If you need additional information, you can easily examine the values of any variables, look at any portion of the program, or find out the sequence of statements executed prior to the error.
Compilation errors
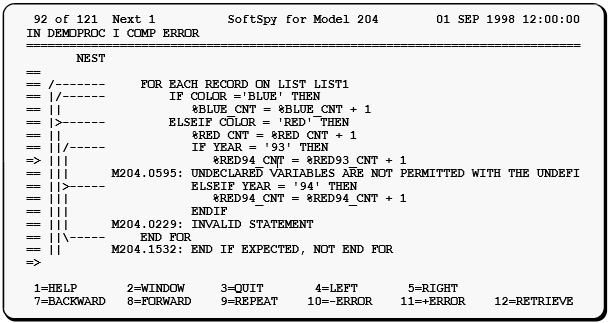
SoftSpy also simplifies tracking down compilation errors. When they occur SoftSpy displays the User Language request. Compilation error messages are embedded within the request immediately following the offending statement.
The current line is positioned on the first line that contains a syntax error. Function keys are provided to jump forward to the next line containing an error or backward to the previous error line.
Interception of compilation errors
Application understanding
Understanding how an application works requires that you run the application to learn the user interface. It also requires that you study the procedures and data used by the application.
SoftSpy allows you to quickly learn how applications work by integrating these activities together. You can clearly see which procedures are responsible for which portions of the user interface, and you can watch the interaction between the program and the data. Seeing this interaction allows rapid in-depth understanding of an application.
SoftSpy also makes it easy to decipher applications written using statement numbers.
Option features
The interactive debugging option provides a number of features that augment the basic SoftSpy environment to provide a robust interactive debugging environment.
Commands
- Establish the interactive debugging environment.
- Scroll forward and backward among statements with compilation errors.
- Scroll backward and forward in the history of previously executed statements.
- Establish actions to perform when compilation or run-time errors are detected.
- Modify the value of fields, global variables and percent variables.
SoftSpy data
Information about the following types of operands is provided:
- fields
- global variables
- image items
- menu items
- percent variables
- screen items
- $ERRMSG
- $STATUS
- $STATUSD
QA option
High quality applications can be delivered only when thorough quality assurance testing is part of the application development process.
However, even the most carefully designed test plans inevitably have some gaps in their coverage.
SoftSpy allows a new approach to testing. It can precisely identify which statements have been tested and which statements have not been tested. This allows you to test your application and determine afterward if test coverage was complete.
You can then adjust your test plans based upon this feedback. The result is your ability to test applications more rigorously in less time.
Even when you know what code is untested, it might be difficult to construct test cases for all possible code paths. SoftSpy lets you alter the flow of control in an executing User Language procedure. This permits complete testing more easily and is especially useful when testing error handling code since appropriate test cases are often difficult to construct.
QA test coverage profile
SoftSpy can produce a detailed quality assurance test coverage profile. A message summarizes how thoroughly the current request has been tested.
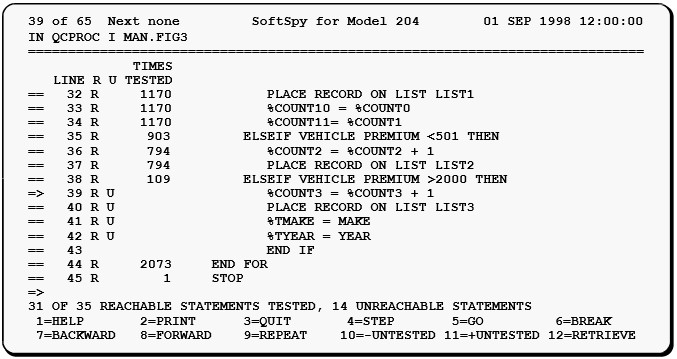
The column labeled "U" contains the letter "U" for each line with an untested executable statement. If an executable statement has been tested then the column labeled "TIMES TESTED" indicates the number of times it was executed.
Quality Assurance test coverage profile
Function keys are provided to allow you to move forward and backward among untested statements. You can also print the test coverage profile for review at a later time.
Unreachable statements
It is possible to have "dead" or unreachable code in requests. For example, code that is unconditionally branched around is unreachable. Similarly, code in a subroutine that can never be called is also unreachable.
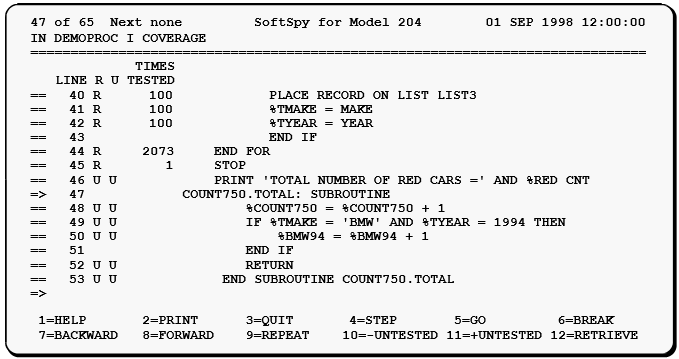
SoftSpy can perform a complete flow analysis of your request in order to identify unreachable code. This allows statements to be classified as either tested, untested and unreachable, or untested and reachable. The presence of untested statements that are reachable indicates further testing is required.
The column labeled "R" indicates whether an executable statement is reachable or unreachable.
Unreachable statements
Option features
The quality assurance testing option provides a number of features that augment the basic SoftSpy environment to provide a robust quality assurance testing environment.
Commands
- Establish the quality assurance testing environment.
- Jump to and execute any statement.
- Exit loops early.
- Advance loops to the next iteration.
- Return from subroutines.
- Force the outcome of expressions.
- Scroll forward and backward among untested statements.
- Scroll forward and backward among unreachable statements.
- Initiate or terminate the collecting of quality assurance data.
- Add or remove columns from the source program display showing quality assurance data.
SoftSpy data
The following information is provided:
- Whether a statement is reachable or unreachable.
- Whether a statement has or has not been tested.
- The number of times a statement has been tested.
TUNE option
SoftSpy provides the information required to tune User Language applications and quickly track down performance bottlenecks. SoftSpy shows precisely which lines within requests consume the most system resources.
SoftSpy also provides detail to identify the underlying activities associated with system level resource consumption. This information enables you to quickly determine the root cause of performance problems.
Performance profile
SoftSpy lets you generate detailed performance profiles. Performance profiles can be tailored using an extensive repertoire of statistics that show all facets of an application's behavior. Resource use can also be displayed graphically using histograms.
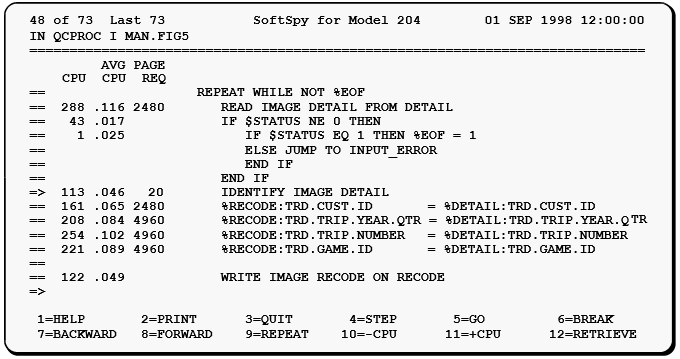
For example, a performance profile can have a "CPU" column that shows the total milliseconds of CPU time and an "AVG CPU" column that shows the average milliseconds of CPU time spent executing each statement. A "PAGE REQ" column can show the number of page requests performed by the disk buffer monitor for each statement.
This type of performance profile shows statements with excessive CPU consumption. It also shows statements that generate excessive page requests. Excessive page requests pinpoint performance-related problems such as the thrashing of images in and out of the buffer pool. This detailed information can explain the cause of a CPU or I/O bottleneck.
Performance Profile
CCATEMP usage
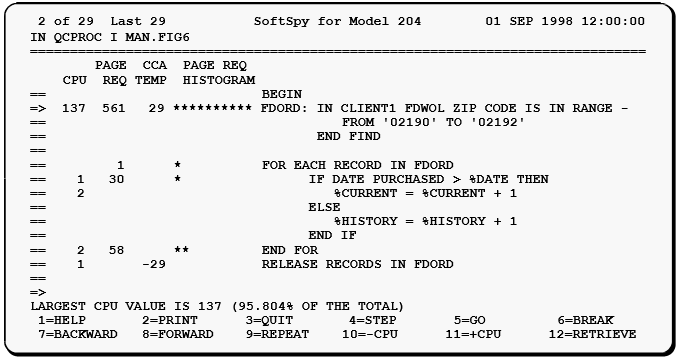
In addition to all normal statistics, SoftSpy can show CCATEMP use by line. The use of CCATEMP is a critical performance factor. Excessive use causes buffer pool thrashing that becomes much worse as overall system load increases. Monitoring CCATEMP use lets you see the real problem, even on a lightly loaded system.
Performance profile with CCATEMP use and histograms
Server table usage
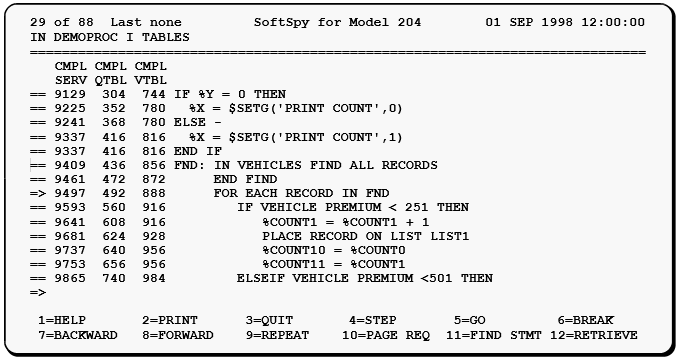
SoftSpy can show detailed statement level usage of server tables. Cumulative server table use can be shown for all server tables, and individually for tables such as QTBL and VTBL. This line by line information allows you to understand and optimize an application's server table use.
Server table usage profile
Performance information
SoftSpy lets application developers display performance information during the normal testing of User Language requests. Observing performance data for a chosen approach is helpful in learning the most efficient way to work with Model 204.
Option features
The interactive performance tuning option provides a number of features that augment the basic SoftSpy environment to provide a robust performance tuning environment.
Commands
- Establish the interactive performance tuning environment.
- Initiate or terminate the collecting of performance data.
- Scroll to statements in a request based on relative resource consumption.
- Add or remove columns from the source program display showing performance data. Totals, averages, percentages, and histograms that show relative use can be displayed.
SoftSpy data
A variety of performance-related information is available:
- Compile time usage by line for individual server tables and for all server tables combined.
- Total, average, percentage or histogram by statement for all performance-related Model 204 statistics including CPU time, page reads, and disk reads and writes.
- Current value of any Model 204 statistic.
- Average usage by statement of CCATEMP pages.
- Current CCATEMP usage.
- CCATEMP usage for a specified found set, sort set, or record list.
- CCATEMP usage for the transaction backout log, the pending update pool, all found sets, all sort sets, or all record lists.
Documentation notation conventions
Standard notation conventions, used throughout the SoftSpy wiki pages, are summarized in the following table:
