Tuning the hash index
Monitoring Table C
To monitor Table C, use the CRETRIES parameter and the TABLEC command. Their use is discussed below.
See also Indexing Fields for more information on choosing the type of indexes for your fields.
Using CRETRIES in Monitoring
The CRETRIES parameter provides the count of the total number of page retries while storing index entries in Table C. Retry indicates a slight degradation in indexed retrieval speeds. Far more significantly (given the limitations in how Table C may be increased), page retries are a signal that Table C is becoming crowded.
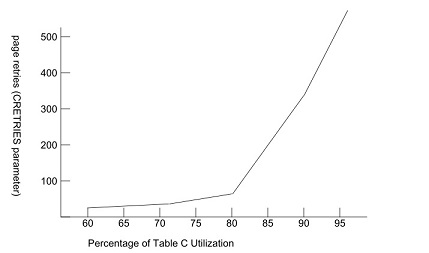
Although these figures vary from file to file, experiments have produced results similar to those in the following diagram. (This is from a small file with CSIZE = 10.)
As shown above, page retries usually are not significant when utilization is below 70 percent. At approximately 72 percent, the number of retries begins to grow more rapidly as utilization increases (new KEY values are added). The point at which retries sharply begin to increase is 80 percent; at 90 percent the slope further increases.
A rough guideline for users concerned with access performance is to aim for 75 percent utilization. If space is the only constraint, you should be able to achieve 85 percent utilization. Remember that this figure varies depending on the characteristics of the data.
Table C never can be 100 percent utilized. A Table C full condition may happen at any point after utilization reaches 85 percent.
Because of this uncertainty, strongly consider the use of the Ordered Index as a replacement for the hashed index. This can be done without code changes. See Indexing Fields for more information.
Using the TABLEC command in Monitoring
Use the TABLEC command to see what percentage of Table C space actually is used.The TABLEC command displays the following information about Table C usage:
- Number of slots available in Table C
- Number of slots used
- Percentage of Table C used
- Total number of property entries
- Number of pages with spills
- Number of primary property entries with overflow
- Percentage of property entries with overflow
For example:
OPEN CENSUS
TABLEC
M204.0638: NUMBER OF SLOTS = 102400
M204.0639: SLOTS USED = 76800
M204.0640: PERCENTAGE OF TABLE C USED = 75
M204.1833: THE TOTAL NUMBER OF PROPERTY ENTRIES IS 7496
M204.1874: THE NUMBER OF PAGES WITH SPILLS IS 33
M204.1834: 2500 PRIMARY PROPERTY ENTRIES HAVE OVERFLOW
M204.1871: THE PERCENTAGE OF PROPERTY ENTRIES WITH OVERFLOW IS 33
Using the TABLEC command to detect overflows
The TABLEC command reports on property entry overflows vs. number of pages with spills. As described in the file architecture discussion, Table C contains
property entries and segment entries.
A field value pair stored in Table C normally consists of one property entry for the pair, and as many segment entries as there are segments having records with that field value. If there is no space available to store an additional segment entry on the page where the property entry resides, the segment entry is created on the next page that has sufficient space.
When this occurs, the property entry page is said to have spilled. Model 204 creates a duplicate property entry on the page spilled onto along with the segment entry placed there. The original property entry is updated to point to this new property entry as an overflow entry.
The effects of this overflow are:
- Additional space is required for the overflow property entry.
- Additional I/O is involved in retrieving the entries during FIND processing.
Because property entry distribution in Table C is entirely dependent on the data values and the hashing algorithm, avoiding overflows might be impossible. However, increasing the size of Table C, which requires recreating the file, might provide a greater dispersal of the Table C entries and, therefore, fewer overflows. As Table C fills and overflows increase, you might have to choose between disk space requirements (not recreating the file) and FIND processing performance (recreating the file).
The number of pages with spills, reported by TABLEC, indicates how uniformly the Table C space is being filled. If the percentage of property entries having overflow is high, and the number of pages with spills is also high, then the file is apparently filling uniformly and might become full if substantial additions to Table C are processed. In this case, you might need to recreate the file and increase Table C.
If the percercentage of property entries having overflow is high, but the number of pages with spills is low, then a “hot spot” or “cluster” exists due to many of the data values hashing to the same page(s). In this case, the file might not be in danger of filling, but performance might be further degraded by the cluster. Experimenting with alternative Table C sizes might alleviate the cluster, but some clusters are probably unavoidable.
In the previous sample TABLEC output, both the percentage of overflows and the number of page spills are relatively high. If substantial additional updating to Table C is anticipated, the percentage of Table C used climbs, and any performance problems caused by too many overflows might be compounded by excessive page retries, or worse, the file will fill. Normally concern for performance (including availability) outweighs the need for disk space, so consider recreating the file with a larger Table C.
In the following sample output, the percentage of overflows is relatively high but the number of page spills is low and the values are clustered. What performance degradation exists might or might not be improved by increasing Table C:
NUMBER OF SLOTS = 102400
SLOTS USED = 76800
PERCENTAGE OF TABLE C USED = 75
THE TOTAL NUMBER OF PROPERTIES IS 7496
800 PRIMARY PROPERTY ENTRIES HAVE OVERFLOW
THE PERCENTAGE OF PROPERTY ENTRIES WITH OVERFLOW IS 10
THE NUMBER OF PAGES WITH SPILLS IS 2
