Category:Tutorial
Background
You've created a beautiful web site, but the only thing missing is a way to easily add bar graphs, pie charts or other business graphics. Fortunately, there is an easy way to do this at little or no cost using FusionCharts Free from InfoSoft Global Ltd. FusionCharts Free supports a generous number of business charts. Of course for more sophisticated options there is a more full featured version, for which you must pay a license fee.
Chart Types Supported
FusionCharts Free supports the following chart types:
- Bar Charts (2D and 3D)
- Pie Charts (2D and 3D)
- Doughnut Charts
- Line Charts
- Area Charts
- Stacked Charts
- Combination (Line & Bar) Charts
- Candlestick Charts
- Funnel Charts
- Gantt Charts
There are 22 different charts, which are rendered as Adobe Flash (.swf) files in the browser using JavaScript.
Getting Started
The first step in using Fusion Charts is of course downloading the source. This can be found on the FusionCharts Free web site. Hint: when you upload the files to your Janus Web Procedure file, upload them as binary files to avoid the dreaded "Code Page" issue. You must then add a Janus Web Rule to send them to the browser as "binary". The data that will populate your chart will come from an XML file that is either created by another program specified by a URL, or coded directly in the charting program.
Using FusionCharts Free with Janus Web
Once you have uploaded your FusionCharts Free JavaScript files to your server and added appropriate Janus Web Rules to send them to the browser, you are ready to code a Janus Web application to chart your data. You might also need to add a web rule to use Adobe Flash for .swf files. I find the "Data URL" method (see FusionCharts Free documentation) the easiest. In your Janus Web Program, you would add a container for your chart and the JavaScript code to call the chart-type JavaScrip and also your data URL. Note: If your data URL program is being passed parameters, the URL must be URL Encoded using the Sirius URLENCODE function or the JavaScript "escape()" method.
In the <head> of your HTML file you will need to include the following:
<SCRIPT LANGUAGE="Javascript" SRC="/FusionCharts/FusionCharts.js"></SCRIPT>
You may need to modify the path name depending on your Janus Web Rules.
You will then add the following code in the <body> of the HTML:
  ...
   HTML
  <div id="chart1div">This text is replaced by the chart
  </div>
  <script type="text/javascript">
   var chart1 = new FusionCharts("Pie2D.swf", "ChId1", "600", "400", "0", "0");
   //To pass parameters, URLEncode the dataURL. Use escape() in JavaScript
   chart1.setDataURL(escape("Data.URL?id=1&subId=2"));
   chart1.render("chart1div");
  </script>
   END HTML
   ...
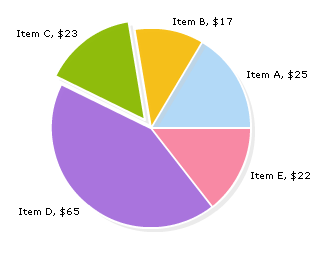
Assuming you have coded up everything properly, the FusionCharts Column2D.swf JavaScript will call the Data.URL User Language program which will return an XML file properly formatted for creating a FusionCharts 2D Column Chart. Here is an example of a Column2D XML File:
 <graph caption='Pie Chart' decimalPrecision='0' showPercentageValues='0' showNames='1' numberPrefix='$' showValues='1' showPercentageInLabel='0' pieYScale='45' pieBorderAlpha='100' pieRadius='100' animation='0' shadowXShift='4' shadowYShift='4' shadowAlpha='40' pieFillAlpha='95' pieBorderColor='FFFFFF'>
  <set value='25' name='Item A' color='AFD8F8'/>
  <set value='17' name='Item B' color='F6BD0F'/>
  <set value='23' name='Item C' color='8BBA00' isSliced='1'/>
  <set value='65' name='Item D' color='A66EDD'/>
  <set value='22' name='Item E' color='F984A1'/>
  </graph>

Debugging
If you see the dreaded JavaScript Error at the bottom of the page, it could be caused by one of the following:
- You actually made an error typing your JavaScript. Remember JavaScript is case sensitive.
- There is a problem with your Janus Web Rules. Check SIRSCAN and look for Janus Web Rule problems
- There is a problem with the DataURL program or Janus Web Rules
- Your XML data is not in the proper format or is not well-formed
Additional Capabilities
You can add even more punch to your FusionCharts data, you can add a drill-down capability by adding a URL to the XML data for a particular Bar or Slice of a chart. You would need to add the link property to the set value for a bar or slice.
<set name='Jan' value='17400' link='n-DemoLinkPages/DemoLink1.html' color='AFD8F8' /
Note: The n- prefix to the link indicates that it is to open in a new window. Leave this off if you want to replace the active page.
Pages in category "Tutorial"
The following 2 pages are in this category, out of 2 total.