TN3270 DEBUG on web threads: Difference between revisions
Created page with "__TOC__ <span class="f_Para">If you license the </span><var>TN3270 Debugger</var><span class="f_Para">, you can use the </span><span class="f_Para" style="font-family: 'Courie..." |
No edit summary |
||
| Line 18: | Line 18: | ||
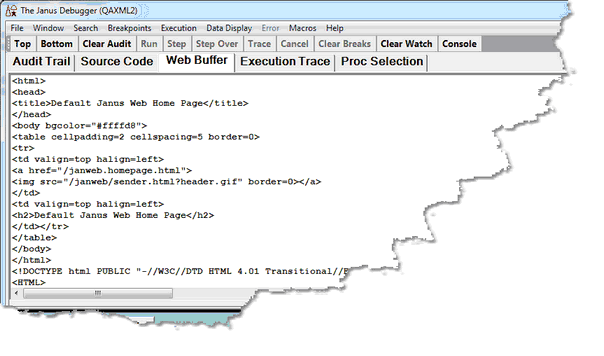
: As the code is evaluated, <span class="f_Para">output [[Viewing the web output buffer|destined for a web page]] goes to</span><span class="f_ListContinue"> a </span><span class="f_GUIlabel">Web Buffer</span><span class="f_ListContinue"> page in the Client: </span> | : As the code is evaluated, <span class="f_Para">output [[Viewing the web output buffer|destined for a web page]] goes to</span><span class="f_ListContinue"> a </span><span class="f_GUIlabel">Web Buffer</span><span class="f_ListContinue"> page in the Client: </span> | ||
[[File:sirdebwebthrd3a_zoom70.gif|604x356px|sirdebWebThrd3a]]<span class="f_ListContinue"> </span> | : [[File:sirdebwebthrd3a_zoom70.gif|604x356px|sirdebWebThrd3a]]<span class="f_ListContinue"> </span> | ||
: When code execution completes, output<span class="f_Para"> (including error messages and Web Buffer contents)</span><span class="f_ListContinue"> is sent to the browser instead of to the </span><var>Model 204</var><span class="f_ListContinue"> "terminal." </span><span class="f_Para">At this point, the connection to the web thread is closed and the debugging session ends. It is not necessary to provide an explicit </span><span class="f_Monospace">TN3270 DEBUG OFF</span><span class="f_Para"> command.</span> | : When code execution completes, output<span class="f_Para"> (including error messages and Web Buffer contents)</span><span class="f_ListContinue"> is sent to the browser instead of to the </span><var>Model 204</var><span class="f_ListContinue"> "terminal." </span><span class="f_Para">At this point, the connection to the web thread is closed and the debugging session ends. It is not necessary to provide an explicit </span><span class="f_Monospace">TN3270 DEBUG OFF</span><span class="f_Para"> command.</span> | ||
Latest revision as of 14:32, 25 April 2023
If you license the TN3270 Debugger, you can use the TN3270 DEBUG ON command to debug Janus Web Server threads. This may be useful if you need to avoid changing the proxy server settings on your web browser.
You invoke a Janus Web procedure from your browser, a TN3270 DEBUG ON command you embedded in the procedure starts the Debugger, and you work with your source code in the Debugger Client as usual. The thread you are debugging counts as one of your TN3270 Debugger authorized "seats."
Using the TN3270 DEBUG command to invoke debugging requires no additional configuration of the Debugger. You must make sure, however, that no proxy server is defined for the browser with which you send a request to the Janus Web Server.
To debug a Janus Web thread:
- In the Janus Web program you want to debug, insert a TN3270 DEBUG ON command to invoke the Janus Debugger. The command must not be placed between explicit BEGIN and END User Language statements.
- Start the Debugger Client.
- Make sure the Client is not automatically maintaining a proxy server for you:
- From the File menu, select Preferences.
- Make sure the Automatically Maintain IE proxy settings checkbox is clear.
- In the browser you use to invoke debugging, confirm that the Debugger Client is not defined as a proxy server.
- From your browser, invoke the URL for the web program that contains the TN3270 DEBUG ON command. The browser pauses in a loading state, and the web program is sent to the Debugger Client Source Code page.
- Work with the procedure code in the Client as usual.
- As the code is evaluated, output destined for a web page goes to a Web Buffer page in the Client:
- When code execution completes, output (including error messages and Web Buffer contents) is sent to the browser instead of to the Model 204 "terminal." At this point, the connection to the web thread is closed and the debugging session ends. It is not necessary to provide an explicit TN3270 DEBUG OFF command.
You can also embed TN3270 DEBUG SUSPEND and RESUME commands in the procedures that are included in your program to take advantage of those features. And you can similarly embed a TN3270 DEBUG OFF command or invoke its equivalent programmable command turnOffDebugging from a Client button or hot key.
Once debugging is on and the Client has the web thread source code, TN3270 DEBUG command input from the command line at the Model 204 host has no effect on debugging — the command line thread is separate from the web thread.
