Category:Debugger Home
This is a master category and page for all things Debugger (Janus/TN3270 Sirius Debugger).
About the Debuggers
The Janus Debugger is a tool designed for developers who create and maintain Janus Web Server applications. With software installed in the Model 204 Online, as well as on a workstation with a browser that can access the Web Server, the Janus Debugger lets you examine in statement by statement detail the SOUL code that the Web Server executes.
The TN3270 Debugger is designed for developers who create and maintain Model 204 3270 and Batch2 applications. With software installed on the Model 204 Online, it uses the same Debugger Client as the Janus Debugger, letting you examine 3270 and Batch2 applications.
An instance of the Debugger Client can be debugging a web application (acting as the Janus Debugger), or it can be debugging a 3270 or Batch2 application (acting as the TN3270 Debugger). At any given time, it may only be debugging one type of application. The title bar of the Debugger Client indicates the application type.
The basic operation
When you are running under the Janus Debugger, and Janus Web Server is about to run a request on your behalf, or you are running under the TN3270 Debugger, and you run a 3270 or Batch2 request:
- Request source code is sent to the Debugger Client deployed on a workstation.
- The Debugger Client displays the code, navigable to top and bottom, with search features available.
- Program execution is paused, the Debugger awaiting the instructions you provide through the Client GUI.
The feature set
Both Debuggers provide these typical debugging capabilities:
- Viewing code while running it
- Stepping through the code one statement at a time
- Examining variable values
- Using a separate "watch window" for the display of specified data items
- Setting breakpoints at which code execution pauses
- Skipping over selected subroutines/methods
In addition, the Debuggers provide:
- A compact Graphical User Interface with user configurable buttons and hot keys
- Views of the Model 204 audit trail and code executed by daemons
- Tracing of statements that modify variables in executed code lines, or tracing until a variable becomes a certain value
- Saving of sets of variables to be watched, which are restorable at any time
- Display of Web Server output (Janus Debugger) and screen variables (TN3270 Debugger)
- A code line's Model 204 procedure details (subsystem, file, name, line number, text preceding dummy string substitution)
- Filtering of program code to skip over all but the Model 204 procedure you identify or the procedures you selected (added to "White List")
- Stepping out of a called subroutine, method, or daemon and continuing processing at the statement after the call to the subroutine, method, or daemon
- Examination of longstrings, $lists, objects
- System class methods that let you insert code in User Language that runs only under the Debuggers
The architecture
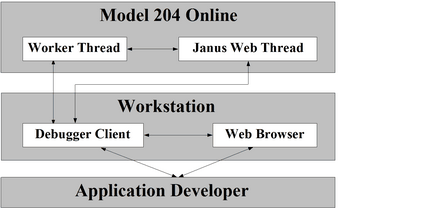
The following figure displays the principal components in a Janus Debugger configuration:
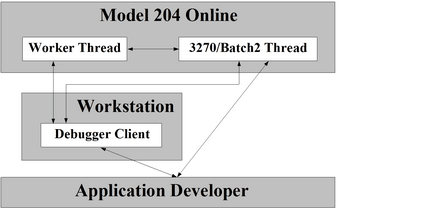
The main components in a TN3270 Debugger configuration parallel those in the Janus Debugger configuration, the principal exception being the absence of the web browser:
Per Debugger session for a Janus Web or 3270 or Batch2 application, these components are active in the Online and on the workstation:
|
Model 204 nucleus hooks (Assembler; not shown above) |
Compiler:
Evaluator:
|
| Janus Web thread | Janus Debugger only. |
| 3270/Batch2 thread | TN3270 Debugger only. |
|
Worker threads (Assembler Language, one for each thread being debugged) |
For each debugging session, a “worker thread” arbitrates between the thread being debugged and the workstation client. A worker thread does the following:
|
|
Debugger Client (Windows GUI, written in VB.NET) |
The Debugger Client resides on the developer's workstation. It is a proxy server in a Janus Debugger session: the browser no longer directly connects to the Web Server, but instead it "sends" to and "receives" from the Client. The Client GUI lets you control the application and view variable values, source code, traces, and for Janus Debugger sessions, the web output buffer. |
| Web browser | Janus Debugger only. Any web browser that allows proxy servers. |
Versions and builds
Independent of the version of Model 204 being run, the Debugger Client has its own numbered sequence of "builds" that contain new and updated features. From build to build of the Debugger Client, the About box (accessed by the Help menu) provides a searchable list of the principal changes in each of the previous builds of the Debugger Client.
System requirements
The Online Configuration section of this document specifies the requirements for Model 204 product release levels, licenses, and maintenance, as well as Debugger product authorization. In addition are instructions for configuring a Model 204 Online that hosts the Debugger, which include User 0 parameter and TCP port definitions and increases in storage table and work area sizes for both of these:
- The worker thread that services a debugging session
- The thread on which the program to be debugged is running
Known limitations
The following are known limitations and issues concerning the Janus and TN3270 Debuggers:
- You may not use either Debugger for DBCS data.
- You may use the Janus Debugger on a Janus Web Legacy Support thread only if you also have a license for the TN3270 Debugger.
- No asynchronous daemon or $COMMBG requests may be debugged. They are simply ignored by the Debugger (and they execute normally).
- The client requires Windows 7 or higher
- Both the Execution Trace tab (output from one trace) and the Web Buffer tab have 5000 line capacities. If the capacity is exceeded, the last 5000 lines are shown.
Check Prerequisites
Ensure you are running Version 7.5 or higher of Model 204. You can verify this by issuing the VIEW VERSION command at the Model 204 command prompt, for example:
VIEW VERSION VERSION 7.9.0A Release of Model 204
Installation and Configuration
This section describes how to install the Janus Debugger, the TN3270 Debugger, or both. Once you complete this installation, you can begin to use either or both products.
This section consists of two subsections of mostly cookbook-style directions. You should first complete the steps in the "Online Configuration" section, then complete the "Workstation Configuration" section.
Most of the steps are to be performed whether you are installing one or both Debugger products, and exceptions are noted.
If you will be using a local editor (Xtend or UltraEdit) with the Debugger, finish the Debugger installation first, then see Using a local editor.
For information about setting up at your site a centralized distribution of updated Debugger Client replacement files, see Providing updated versions of the Debugger Client.
Online Configuration
This section shows how to prepare a Model 204 Online for use of the Janus Debugger, the TN3270 Debugger, or both.
The installation tasks require Model 204 system manager privileges. Also, since you must set at least one User 0 parameter, a cycle of the Model 204 Online will be required.
The Online configuration tasks are listed below.
- Check prerequisites
- Authorize the Debugger
- Set Model 204 system parameters
- Define and start the Debugger Server port
- Define and start a client socket port (TN3270 Debugger only)
Workstation Configuration
This section specifies how to prepare a workstation for use by the Janus Debugger, TN3270 Debugger, or both.
These are the workstation configuration tasks:
- Perform preliminary tasks
- Run, check, and verify the Client installation
- Customize the debuggerConfig.xml file
- Configure the web browser (Janus Debugger only)
- Test the end-to-end configuration
Menu Bar
The Debugger Client has multiple menus, each of which is described in the following subsections. Many of the menu options duplicate the actions of default Client buttons and keyboard shortcuts, and most menu options are associated with Client commands.
If a hot key is mapped to a command that is associated with a menu option, the hot key is displayed in parentheses next to the menu option.
- The File menu options
- The Window menu options
- The Search menu options
- The Breakpoints menu options
- The Execution menu options
- The Data Display menu options
- The Error menu options
- The Macros menu options
- The Help menu options
Performing Basic GUI tasks
These sections describe how you perform basic operations using the Debugger:
- Controlling the execution of program code
- Viewing and modifying program elements
- Getting source file, audit trail, and web buffer information
- Tracing program execution
- Viewing programs that contain coding errors
- Debugging requests that spawn daemons
- Debugging Web Server persistent sessions
- Debugging multiple Web Servers
Using Debugger Macros
A macro lets you execute one or more commands as a single unit of work to automate an often-repeated series of operations.
Subsequent sections describe:
Subcategories
This category has the following 3 subcategories, out of 3 total.
Pages in category "Debugger Home"
The following 114 pages are in this category, out of 114 total.
A
C
- Cancelling execution
- Changing the colors in Client displays
- Changing the font size in Client displays
- Changing the location of Client work files
- Check Debugger Prerequisites
- Client Command Reference
- Configure web browser (Janus Debugger only)
- Controlling the execution of program code
- Copying, printing, or saving text
- Creating and running a macro
- Customize debuggerConfig file
D
- Data Display menu options (Debugger)
- Debugger &&functions
- Debugging multiple Web Servers
- Debugging requests that spawn daemons
- Debugging the Janus Debugger
- Debugging the TN3270 Debugger
- Debugging Web Server persistent sessions
- Default settings of buttons and hot keys
- Define and start a client socket port (TN3270 Debugger only)
- Define and start the Debugger Server port
- Displaying $lists, Stringlists, and Arraylists
- Displaying a statement history
- Displaying all fields in a record
- Displaying all Variables of an object's class
- Displaying Janus SOAP XML document objects
- Displaying line information and editing procedures
- Displaying Model 204 parameters
- Displaying temporarily the value of a program data item
- Displaying the current occurrence value in an FEO loop
- Displaying the Universal Buffer content
E
G
H
P
R
S
- Saving and restoring Watch Window contents
- Search facility
- Search menu options
- Seeing through Client windows
- Selectively excluding source code blocks
- Set Model 204 system parameters
- Setting the value of a variable
- Setting up the ui.xml file
- Specifying a startup command for the Client
- Status bar
- Step, Step Over, and Run
- Stepping out
- Suppressing the break at the end of request evaluation
T
- Test the end to end configuration
- The lower windows
- The tabbed pages
- TN3270 DEBUG on web threads
- TN3270 DEBUG Syntax
- TN3270 DEBUG WAIT
- Tracing all lines executed
- Tracing all updates to a variable's value
- Tracing options
- Tracing program execution
- Tracing until a value change or until a value match
- Tracking Client performance


