How the Janus Debugger handles communication breaks
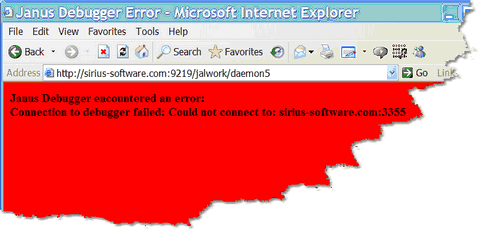
If the Janus Debugger is not properly configured or if communication between any of its components is lost, the Debugger Client or the browser or both will display error messages and will attempt to restore normal operation, typically without requiring a recycling of any of the components.
In most cases, as long as the Debugger Client itself is not the problem, these communication breaks are signaled by the Client with a Communication Error message box and the display of Communication Error in the Status bar.
This section describes the most likely types of communication breaks (not related to product configuration) and how the Debugger responds. The subsections below (except for the last) are organized by the Client's Communication Error message:
- Invalid response from debugger: info
- An existing connection was forcibly closed by the remote host
- The Debugger Client is not available
Invalid response from debugger: info
info is one of the following:
- An existing connection was forcibly closed by the remote host
- In this case, the network connection between the PC and the Online is lost, or the Debugger Server port is not started.
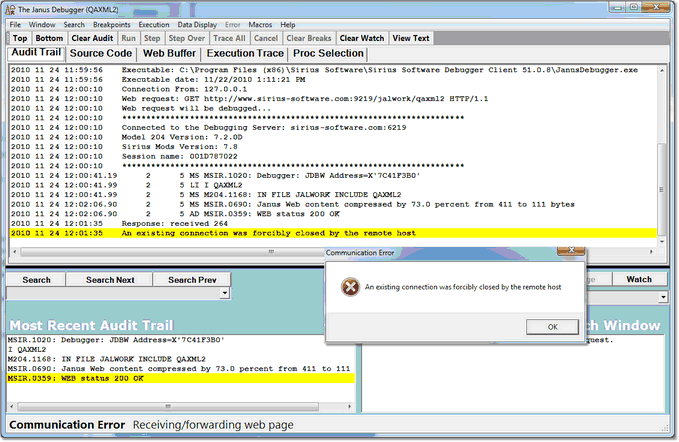
- If the Debugger Client was in the process of debugging code, the next Client operation you attempt produces a Client message like the following, and Communication Error is displayed in the Status bar:
- Clicking OK here removes the message, but processing cannot continue until the connection to the Online is reestablished or the Debugger port on the Online is restarted. There is no need to recycle the Debugger Client, although any program that was being processed is discarded.
- If the browser was waiting while the Debugger Client was processing, it continues to wait. If no debugging was in process, and the browser sends a new request to the Web Server, the browser is sent a reply from the Client like the following:
- Once the broken connection is reestablished, debugging continues when the browser sends or resends a request. There is no need to recycle the browser.
- Worker thread lost
- The Web Server or Debugger Server encounters a Model 204 or Janus error while doing work for the Client, leaving the Client in an extended waiting state (Waiting for Online is displayed in the Status bar).
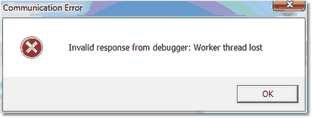
In such a case, the Server eventually times out (two minutes), and the Client displays Communication Error in the Status bar as well as an error message box like the following:
- Shortly thereafter, the Client resumes processing, and the browser waits and follows its own timeout default.
You can review the Audit Trail page for information to help locate the error in the Online processing.
An existing connection was forcibly closed by the remote host
Two cases of these browser problems follow:
- An external connection to the browser is broken.
- As a new browser session begins, the Debugger processing is halted and a Communication Error message like the following is displayed:
- In its role as the browser's proxy, the Debugger Client has received an error notification from a site that the browser has contacted, say to load an image, as part of its normal setup and home page presentation.
- Such errors are infrequent and usually harmless, and clicking OK releases the Debugger to continue processing.
- The browser breaks the connection to the Debugger Client.
- As the Debugger Client is processing code that a Janus Web Server sends in response to a browser request, a user sends another browser request (or the browser sends a scheduled polling request). The Client-browser socket gets broken, and the Client displays a message like the one shown above. When you click the message OK button, the Client-browser socket gets reestablished.
The Debugger Client is not available
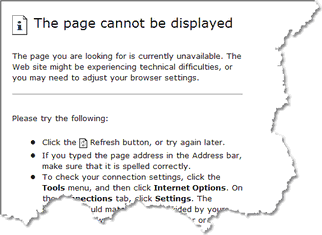
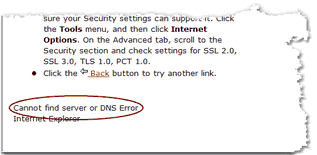
Browser requests return a "cannot find server" or "proxy server is unavailable" message like the following when the Debugger Client goes down or is not started:
Once the Debugger Client becomes available, debugging continues when the browser sends or resends a request. There is no need to recycle the browser.

