Tracing all lines executed
The simplest form of tracing starts from the current execution point and notes which lines were executed. You invoke this feature by clicking the Trace All button on the button bar (or by pressing the CTRL-T keyboard combination (by default), or by selecting the Trace To End option in the Client's Execution menu).
The tracing continues until one of the following events:
- The request ends
- A breakpoint is hit
- A cancelling error occurs
- A daemon is entered
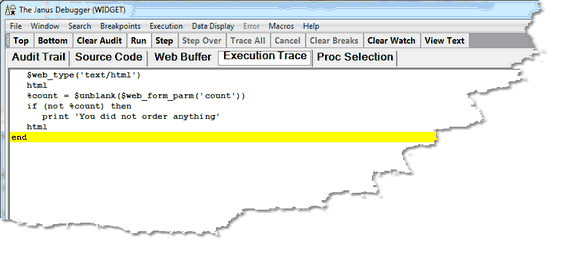
The output, a list of the statements executed, is displayed in the Execution Trace tab:
If tracing was interrupted by a breakpoint or by daemon code, you can continue tracing by clicking the Trace All button again or by pressing the Enter key.
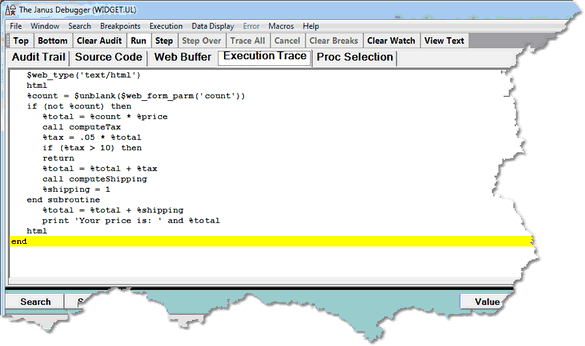
The Execution Trace tab display can help you with testing. You can see from the code in the example trace, above, that the execution path hit only the case where no orders are made. Contrast this with a trace of the same program where something was ordered:

