SirMon File Monitor menu: Difference between revisions
m 1 revision: SirMon pages |
Automatically generated page update |
||
| (4 intermediate revisions by one other user not shown) | |||
| Line 1: | Line 1: | ||
Option 4 from the main menu presents a menu of file statistics screens. | Option 4 from the main menu presents a menu of file statistics screens. | ||
This menu is also accessible by entering <code>=4</code> in the command | This menu is also accessible by entering <code>=4</code> in the command | ||
line of any <var class="product">SirMon</var> screen. | line of any <var class="product">SirMon</var> screen. In [[RKWeb]], expanding the <code>Performance > Files</code> menu of the <code>Monitor</code> tab displays these statistics options in a sub-menu. | ||
<p class="caption" style="width:475px">File Monitor menu</p> | |||
<p class="figure">[[File:SmonFileMon.png|475px]]</p> | |||
Selecting any of these numbered file statistics options presents a "scrollable screen" (see [[SirMon application structure#Scrollable screen format|Scrollable screen format]]) of specific statistics for all open files in the Online system. The PF1 key displays definitions for the presented statistics: | |||
<table class="thJustBold"> | |||
<tr class="head"><th>Number</th> | |||
<th>Option</th> | |||
<th>Description</th></tr> | |||
< | <tr><th>U </th> | ||
< | <th nowrap>Update the selection menu</th> | ||
<td>Allows <var class="product">SirMon</var> administrators to customize the File Monitor menu.</td></tr> | <td>Allows <var class="product">SirMon</var> administrators to customize the File Monitor menu.</td></tr> | ||
<tr><th> | <tr><th>A </th> | ||
<td>An | <th>User AD-HOC</th> | ||
<td>An ad hoc view of file statistics specific to each <var class="product">SirMon</var> user.</td></tr> | |||
<tr><th> | <tr><th>1 </th> | ||
<th>File Activity</th> | |||
<td>Display of disk activity, file enqueue counts, total page buffer utilization, and critical file resource conflicts.</td></tr> | <td>Display of disk activity, file enqueue counts, total page buffer utilization, and critical file resource conflicts.</td></tr> | ||
<tr><th> | <tr><th>2 </th> | ||
<th>Buffer Usage</th> | |||
<td>Detailed breakdown of each file's disk buffer usage by table together with disk read and write rates.</td></tr> | <td>Detailed breakdown of each file's disk buffer usage by table together with disk read and write rates.</td></tr> | ||
<tr><th nowrap> | <tr><th nowrap>3 </th> | ||
<th>Critical File Resource</th> | |||
<td>Shows each category of resource conflict as a rate and the total number if users waiting on various critical file resources.</td></tr> | <td>Shows each category of resource conflict as a rate and the total number if users waiting on various critical file resources.</td></tr> | ||
<tr><th>4 | <tr><th>4 </th> | ||
<th>File Table Usage</th> | |||
<td>Shows file space utilization information for each open <var class="product">Model 204</var> file, broken down by table type.</td></tr> | <td>Shows file space utilization information for each open <var class="product">Model 204</var> file, broken down by table type.</td></tr> | ||
<tr><th> | <tr><th>5 </th> | ||
<th>Ordered Index Usage</th> | |||
<td>Information about ordered index data density and usage.</td></tr> | <td>Information about ordered index data density and usage.</td></tr> | ||
</table> | </table> | ||
| Line 41: | Line 44: | ||
As many as 27 locally defined screens may also be accessed from the File | As many as 27 locally defined screens may also be accessed from the File | ||
Monitor menu. | Monitor menu. | ||
These screens are defined by a <var class="product">SirMon</var> administrator as described in | These screens are defined by a <var class="product">SirMon</var> administrator as described in [[SirMon custom screens]]. | ||
[[SirMon custom screens]]. | |||
A number of special commands allow limiting the view of selected files | ==File Monitor commands== | ||
A number of special commands (TN3270 interface only) allow limiting the view of selected files: | |||
<table class="thJustBold"> | <table class="thJustBold"> | ||
<tr><th>FILE <i>xxxxxxxx</i></th> | <tr><th>FILE <i>xxxxxxxx</i></th> | ||
| Line 61: | Line 64: | ||
</table> | </table> | ||
==Zoom and Detail views== | |||
All File Monitor screens give the option of zooming (the PF6 key) or obtaining a detail view (the PF10 key) on an individual file. | All File Monitor screens give the option of zooming (the PF6 key) or obtaining a detail view (the PF10 key) on an individual file. | ||
The cursor must be positioned over a line of file statistics to determine | The cursor must be positioned over a line of file statistics to determine | ||
the file for which Zoom or Detail statistics are required. | the file for which Zoom or Detail statistics are required. In RKWeb, clicking a line of statistics opens a combined Zoom and Detail view. | ||
<ul> | <ul> | ||
<li> | <li>Zoom presents a non-scrollable screen (refer to [[SirMon application structure#Non-scrollable screen format|Non-scrollable screen format]]) | ||
with the same statistics as were presented on the original screen, but with screen lines representing time-sliced views of the selected file's performance. </li> | with the same statistics as were presented on the original screen, but with screen lines representing time-sliced views of the selected file's performance. </li> | ||
<li> | <li>Detail presents a display of most of the important statistics that can | ||
be displayed for any single file: </li> | be displayed for any single file: </li> | ||
</ul> | </ul> | ||
<p class="caption" style="width: | <p class="caption" style="width:475px">File Detail screen</p> | ||
<p class="figure">[[File:SmonFileDetail.png| | <p class="figure">[[File:SmonFileDetail.png|475px]]</p> | ||
The PF3 key from a Zoom or Detail screen returns the original File Monitor screen. | The PF3 key from a Zoom or Detail screen returns the original File Monitor screen. | ||
Latest revision as of 21:50, 6 June 2017
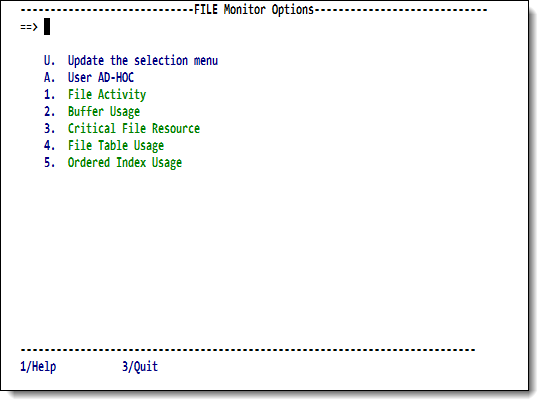
Option 4 from the main menu presents a menu of file statistics screens.
This menu is also accessible by entering =4 in the command
line of any SirMon screen. In RKWeb, expanding the Performance > Files menu of the Monitor tab displays these statistics options in a sub-menu.
File Monitor menu
Selecting any of these numbered file statistics options presents a "scrollable screen" (see Scrollable screen format) of specific statistics for all open files in the Online system. The PF1 key displays definitions for the presented statistics:
| Number | Option | Description |
|---|---|---|
| U | Update the selection menu | Allows SirMon administrators to customize the File Monitor menu. |
| A | User AD-HOC | An ad hoc view of file statistics specific to each SirMon user. |
| 1 | File Activity | Display of disk activity, file enqueue counts, total page buffer utilization, and critical file resource conflicts. |
| 2 | Buffer Usage | Detailed breakdown of each file's disk buffer usage by table together with disk read and write rates. |
| 3 | Critical File Resource | Shows each category of resource conflict as a rate and the total number if users waiting on various critical file resources. |
| 4 | File Table Usage | Shows file space utilization information for each open Model 204 file, broken down by table type. |
| 5 | Ordered Index Usage | Information about ordered index data density and usage. |
As many as 27 locally defined screens may also be accessed from the File Monitor menu. These screens are defined by a SirMon administrator as described in SirMon custom screens.
File Monitor commands
A number of special commands (TN3270 interface only) allow limiting the view of selected files:
| FILE xxxxxxxx | Restricts the display to files that match the pattern specified in xxxxxxxx. For example, this command limits the display of files to only those whose names begin with "GLB":
FILE GLB* |
|---|---|
| USER xxxx | Restricts the display to files that are open by the user number specified. Wildcards are not allowed with this command. |
| SUBSYS xxxxxxxx | Restricts the display to files that are open by the subsystem specified in xxxxxxxxxx. Wildcards are not allowed in subsystem specification. |
| ALL | The command ALL removes any restrictions on the display. The display returns to showing all files. |
Zoom and Detail views
All File Monitor screens give the option of zooming (the PF6 key) or obtaining a detail view (the PF10 key) on an individual file. The cursor must be positioned over a line of file statistics to determine the file for which Zoom or Detail statistics are required. In RKWeb, clicking a line of statistics opens a combined Zoom and Detail view.
- Zoom presents a non-scrollable screen (refer to Non-scrollable screen format) with the same statistics as were presented on the original screen, but with screen lines representing time-sliced views of the selected file's performance.
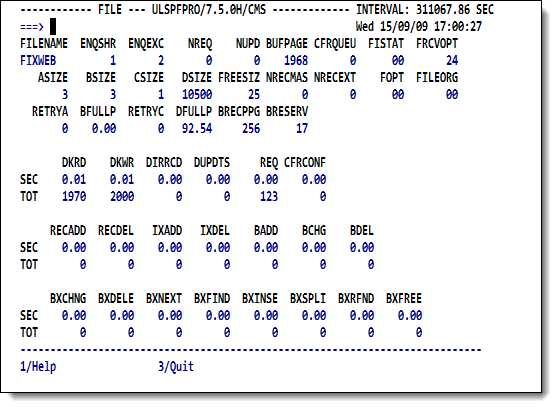
- Detail presents a display of most of the important statistics that can be displayed for any single file:
File Detail screen
The PF3 key from a Zoom or Detail screen returns the original File Monitor screen.
See also
- SirMon
- SirMon application structure
- SirMon main menu
- SirMon System Overview screen
- SirMon threshold setting
- SirMon background monitor
- SirMon System Monitor menu
- SirMon User Monitor menu
- SirMon File Monitor menu
- SirMon Subsystem Monitor menu
- SirMon Task Monitor menu
- SirMon Janus Monitor menu
- SirMon custom screens
- SirMon critical-file-resource monitoring
- SirMon user-initiated capturing of statistics
- System statistics displayed in SirMon
- User statistics displayed in SirMon
- File statistics displayed in SirMon
- Subsystem statistics displayed in SirMon
- Task statistics displayed in SirMon
- Critical File Resource statistics displayed in SirMon
- SirMon date processing

