SirMon Janus Monitor menu: Difference between revisions
Jump to navigation
Jump to search
m minor formatting |
m add more info |
||
| (One intermediate revision by the same user not shown) | |||
| Line 41: | Line 41: | ||
<tr><th>4 </th> | <tr><th>4 </th> | ||
<th>Web Performance</th> | <th>Web Performance</th> | ||
<td> </td></tr> | <td>A display of the current activity of the Janus ports defined to your Model 204 Online showing a view of bytes transferred and averages per read and write. </td></tr> | ||
</table> | </table> | ||
==Zoom and Detail views== | |||
All Janus Monitor screens give the option of zooming (the PF6 key) | All Janus Monitor screens give the option of zooming (the PF6 key) | ||
on an individual line. The cursor must be on a valid output line. | or obtaining a detail view (the PF10 key) on an individual line. The cursor must be on a valid output line. | ||
Zoom presents a [[SirMon application structure#Non-scrollable screen format|non-scrollable screen]] with the same statistics as were presented on the original screen, but | <ul> | ||
<li>Zoom presents a [[SirMon application structure#Non-scrollable screen format|non-scrollable screen]] with the same statistics as were presented on the original screen, but showing time-sliced views of the selected content. </li> | |||
<li>Detail presents a display of most of the important statistics and information that can be displayed for any single port. </li> | |||
</ul> | |||
==See also== | ==See also== | ||
Latest revision as of 22:04, 28 June 2017
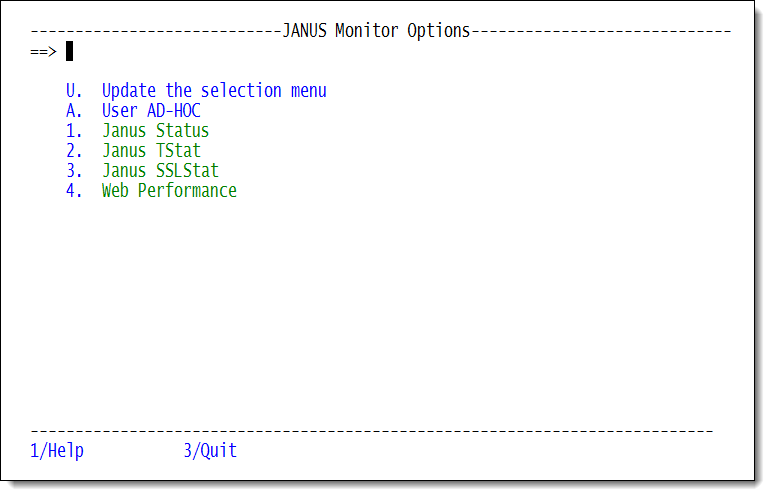
Option 7 from the main menu presents a menu of Janus port statistics screens.
This menu is also accessible by entering =7 in the
command line of any SirMon screen. In RKWeb, expanding the Performance > Janus Ports menu of the Monitor tab displays these statistics options in a sub-menu.
Janus Monitor menu
Selecting a numbered option from this menu opens a scrollable screen displaying output from a JANUS port-related command. The PF1 key on such a screen displays definitions for the presented statistics.
| Number | Option | Description |
|---|---|---|
| U | Update the selection menu | Allows SirMon administrators to customize the Janus Monitor menu. |
| A | User AD-HOC | An adhoc view of Janus port statistics specific to each SirMon user. |
| 1 | Janus Status | A detailed display of the current status of the Janus ports defined to your Model 204 Online. This is the output from the JANUS STATUS command. |
| 2 | Janus TStat | A detailed display of thread usage activity on Janus ports. This information can prove useful in isolating problems with thread availability and in doing capacity planning. This is the output from the JANUS TSTAT command. |
| 3 | Janus SSLStat | A detailed display of the SSL activity for each combination of Janus port and network security protocol. "SSL activity" refers to Janus Network Security encrypted communications on a Janus port whose definition includes an SSL parameter specification. Each port is listed under the Portname header.
This is the output from the JANUS SSLSTAT command. |
| 4 | Web Performance | A display of the current activity of the Janus ports defined to your Model 204 Online showing a view of bytes transferred and averages per read and write. |
Zoom and Detail views
All Janus Monitor screens give the option of zooming (the PF6 key) or obtaining a detail view (the PF10 key) on an individual line. The cursor must be on a valid output line.
- Zoom presents a non-scrollable screen with the same statistics as were presented on the original screen, but showing time-sliced views of the selected content.
- Detail presents a display of most of the important statistics and information that can be displayed for any single port.
See also
- SirMon
- SirMon application structure
- SirMon main menu
- SirMon System Overview screen
- SirMon threshold setting
- SirMon background monitor
- SirMon System Monitor menu
- SirMon User Monitor menu
- SirMon File Monitor menu
- SirMon Subsystem Monitor menu
- SirMon Task Monitor menu
- SirMon Janus Monitor menu
- SirMon custom screens
- SirMon critical-file-resource monitoring
- SirMon user-initiated capturing of statistics
- System statistics displayed in SirMon
- User statistics displayed in SirMon
- File statistics displayed in SirMon
- Subsystem statistics displayed in SirMon
- Task statistics displayed in SirMon
- Critical File Resource statistics displayed in SirMon
- SirMon date processing
