Displaying a statement history: Difference between revisions
No edit summary |
No edit summary |
||
| (3 intermediate revisions by the same user not shown) | |||
| Line 5: | Line 5: | ||
: 1. In the Client's <var>Execution</var> menu, select the <var>Get/Display History</var> option. | : 1. In the Client's <var>Execution</var> menu, select the <var>Get/Display History</var> option. | ||
:: The <var>Execution History</var> window displays a history of statements executed up to the program's current execution point: | :: The <var>Execution History</var> window displays a history of statements executed up to the program's current execution point. | ||
: [[File:exechist1b_zoom55.gif|434x300px|ExecHist1b]] | |||
[[File:exechist1b_zoom55.gif|434x300px|ExecHist1b]] | |||
:: The execution history is as many as the last 1000 statements executed. Calls and returns for methods and subroutines are labeled: | :: The execution history is as many as the last 1000 statements executed. Calls and returns for methods and subroutines are labeled: | ||
| Line 25: | Line 24: | ||
# Select <var>Preferences</var> from the </span><var>File</var> menu. | # Select <var>Preferences</var> from the </span><var>File</var> menu. | ||
# In the <var>Display Options</var> section of the <var>Preferences</var> dialog box, enable the feature by selecting the <var>History to Execution Trace</var> checkbox (it is clear by default), then click <var>Done. | # In the <var>Display Options</var> section of the <var>Preferences</var> dialog box, enable the feature by selecting the <var>History to Execution Trace</var> checkbox (it is clear by default), then click <var>Done. | ||
: [[File:preferences23g_zoom55.gif|556x377px|preferences23g]] | |||
[[File:preferences23g_zoom55.gif|556x377px|preferences23g]] | |||
'''Note:''' The Client [[setPreference command|setPreference]] command has an option that lets you toggle the <var>History to Execution Trace</var> checkbox. | '''Note:''' The Client [[setPreference command|setPreference]] command has an option that lets you toggle the <var>History to Execution Trace</var> checkbox. | ||
| Line 39: | Line 37: | ||
: 1. At any point during the debugging of a request after some statements have been executed, either: | : 1. At any point during the debugging of a request after some statements have been executed, either: | ||
:: a. Open the <var>Execution</var> menu, and click one of the history selection options: <var>[[ | :: a. Open the <var>Execution</var> menu, and click one of the history selection options: <var>[[Execution menu options|Select Previous History Line]]</var>, <var>[[Execution menu options|Select Next History Line]]</var>, <var>[[Execution menu options|Select First History Line]], </var><var>[[Execution menu options|Select Last History Line.]]</var> | ||
: Or: | : Or: | ||
:: b. Run (mapped to a button or key, or via macro or command line) one of the Client commands that corresponds to the above mentioned menu options: [[previousHistory command|previousHistory]], [[nextHistory command|nextHistory]], [[firstHistory command|firstHistory]], [[lastHistory command|lastHistory.]] | :: b. Run (mapped to a button or key, or via macro or command line) one of the Client commands that corresponds to the above mentioned menu options: [[previousHistory command|previousHistory]], [[nextHistory command|nextHistory]], [[firstHistory command|firstHistory]], [[lastHistory command|lastHistory.]] | ||
: The Client responds by moving the current line to the executed statement you selected in the <var>Source Code</var> or <var>Daemon</var> page that contains the statement. | :: The Client responds by moving the current line to the executed statement you selected in the <var>Source Code</var> or <var>Daemon</var> page that contains the statement. | ||
: 2. Continue reviewing the executed statements by using the <var>Execution</var> menu history options or their command counterparts. | : 2. Continue reviewing the executed statements by using the <var>Execution</var> menu history options or their command counterparts. | ||
:: The Client locates and highlights the statement you select, and it removes the highlighting from the statement you viewed in the previous step. | :: The Client locates and highlights the statement you select, and it removes the highlighting from the statement you viewed in the previous step. | ||
: '''Note:''' Although each history statement you view gets highlighted as if it were the current execution position, the actual execution position, the statement to be executed next if you invoke a debugging Step or Run operation, remains where it was when you began reviewing the statement history. | :: '''Note:''' Although each history statement you view gets highlighted as if it were the current execution position, the actual execution position, the statement to be executed next if you invoke a debugging Step or Run operation, remains where it was when you began reviewing the statement history. | ||
: 3. Resume normal debugging operations. | : 3. Resume normal debugging operations. | ||
[[Category:Debugger Home]] | [[Category:Debugger Home]] | ||
Latest revision as of 19:10, 19 April 2023
If you are in the middle of debugging a lengthy or complicated program, and you have not invoked tracing, you can produce a display of all the statements that have already executed. Perhaps you got an unexpected runtime error or hit a breakpoint you set, and you want to review how you got to this point in the program.
To display a history of statement execution:
- 1. In the Client's Execution menu, select the Get/Display History option.
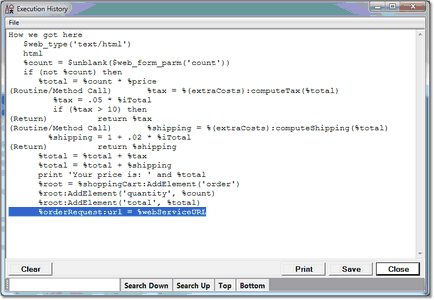
- The Execution History window displays a history of statements executed up to the program's current execution point.

- The execution history is as many as the last 1000 statements executed. Calls and returns for methods and subroutines are labeled:
- For a call, a (Routine/Method Call) indicator precedes the User Language statement.
- For a return, a (Return) indicator precedes the User Language statement.
- While the Execution History window is open, you can interact with the main Client window, and any hot keys defined for the Client will work when the history viewer has focus.
- 2. Use the Clear, Print, Save, and Close buttons as necessary. And the search bar on the bottom of the window provides controls for searching the history.
- You can also invoke this feature with the getHistory mappable command, clear the window with the clearHistory command, and close the window with the closeHistory command.
Using the Execution Trace tab
You can arrange to view the statement history in the Execution Trace page instead of in the Execution History window:
- Select Preferences from the File menu.
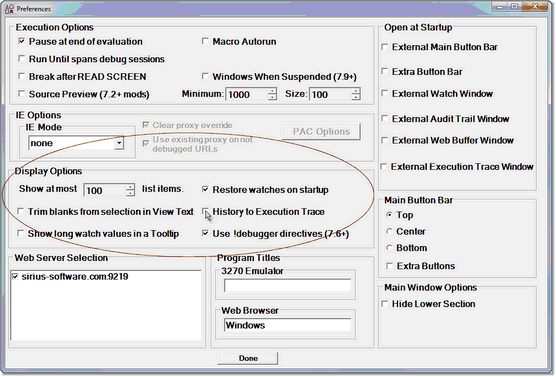
- In the Display Options section of the Preferences dialog box, enable the feature by selecting the History to Execution Trace checkbox (it is clear by default), then click Done.
Note: The Client setPreference command has an option that lets you toggle the History to Execution Trace checkbox.
- 3. Invoke a statement history as usual from the Execution menu.
Using the Source Code tab
You can review the statements in the execution history in their actual context, that is, highlighted in the program in the Source Code tab (or Daemon tab). Four Execution menu options (or corresponding Client commands) let you select which executed statement(s) to view: the first or the last (that is, the statement at the beginning or the end of the history), or the previous or the next executed statement, relative to the currently highlighted line.
To inspect in the program code a previously executed statement:
- 1. At any point during the debugging of a request after some statements have been executed, either:
- a. Open the Execution menu, and click one of the history selection options: Select Previous History Line, Select Next History Line, Select First History Line, Select Last History Line.
- Or:
- b. Run (mapped to a button or key, or via macro or command line) one of the Client commands that corresponds to the above mentioned menu options: previousHistory, nextHistory, firstHistory, lastHistory.
- The Client responds by moving the current line to the executed statement you selected in the Source Code or Daemon page that contains the statement.
- 2. Continue reviewing the executed statements by using the Execution menu history options or their command counterparts.
- The Client locates and highlights the statement you select, and it removes the highlighting from the statement you viewed in the previous step.
- Note: Although each history statement you view gets highlighted as if it were the current execution position, the actual execution position, the statement to be executed next if you invoke a debugging Step or Run operation, remains where it was when you began reviewing the statement history.
- 3. Resume normal debugging operations.
