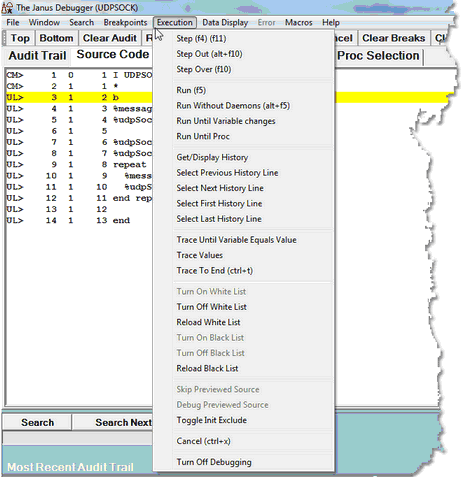
Execution menu options
The Execution menu options are identified below:
| Step | Executes the next executable User Language statement. |
| Step Out | Discontinues debugging and leaves the current simple or complex subroutine, user method, or daemon, and resumes debugging on the statement following the statement that called that subroutine, user method, or daemon. Described further in Stepping out. |
| Step Over | Executes the next executable SOUL statement, if it is not a simple or complex Model 204 subroutine or an OO method. Skips to the statement after, if the next executable statement is such a subroutine or method invocation. Same as using the Step Over button. |
| Run | Executes User Language statements in the program being debugged until the end of the request or until interrupted by a breakpoint, program error, or daemon call. |
| Run Without Daemons | Performs the same functionality as Run, but unlike Run, is not interrupted by daemon code. |
| Run Until Variable Changes | Steps through the program being debugged, stopping if a statement modifies the value of the variable specified in the text box above the Watch Window. Displays the statement that modified the variable and the new variable value in the Execution Trace tab. Same as the Run to Change button. |
| Run Until Proc | Runs program code without interruption until it reaches the procedure specified on the Proc Selection page in the Run Until Procedure text box, then displays that procedure for debugging. Same as the Run to Procedure button. |
| Get/Display History | Displays a history of the statements executed thus far during program evaluation. The history includes calls and returns for methods and subroutines (as many as 1000 statements). |
| Select Previous History Line |
Scans chronologically backward in the statement execution history, then highlights in the Source Code or Daemon tab the statement that was executed immediately prior to the statement that is currently highlighted with the Execution Position color. Same as the previousHistory command. |
| Select Next History Line |
Scans chronologically forward in the statement execution history, then highlights in the Source Code or Daemon tab the statement that was executed immediately following the statement that is currently highlighted with the Execution Position color. Same as the nextHistory command. |
| Select First History Line |
Scans chronologically backward in the current statement execution history, then highlights in the Source Code or Daemon tab the first (earliest) statement in the history. Same as the firstHistory command. |
| Select Last History Line |
Scans chronologically forward in the current statement execution history, then highlights in the Source Code or Daemon tab the last (latest) statement in the history. Same as the lastHistory command. |
| Trace Until Variable Equals Value | Steps through the program being debugged, stopping if a statement modifies the value of the variable specified in the text box above the Watch Window so that it equals a value you specify. Displays the statement that modified the variable and the new variable value in the Execution Trace tab. Same as ALT-Run to Change button. |
| Trace Values | Performs the same functionality as Run, but also reports in the Execution Trace tab all statements that modify a selected variable and what value was assigned to the variable. Described further in Tracing all updates to a variable's value. |
| Trace To End | Performs the same functionality as Run, but also reports in the Execution Trace tab a list of all the statements executed. Described further in Tracing all lines executed. |
| Turn On White List | Activates White List filtering, which by default is not active. Same as clicking the Turn On White List button on the Proc Selection page or executing the turnOnWhiteList command. |
| Turn Off White List | Deactivates White List filtering. Same as clicking the Turn off Lists button on the Proc Selection page or executing the turnOffWhiteList command. |
| Reload White List | Updates the existing White List with the current contents of the whitelist.txt file, so you can dynamically update your White List. Same as clicking the Reload White List button on the Proc Selection page or executing the reloadWhiteList command. |
| Turn On Black List | Activates Black List filtering, which by default is not active. Same as clicking the Turn On Black List button on the Proc Selection page or executing the turnOnBlackList command. |
| Turn Off Black List | Deactivates Black List filtering. Same as clicking the Turn off Lists button on the Proc Selection page or executing the turnOffBlackList command. |
| Reload Black list | Updates the existing Black List with the current contents of the blacklist.txt file, so you can dynamically update your Black List. Same as clicking the Reload Black List button on the Proc Selection page or executing the reloadBlackList command. |
| Skip Previewed Source | When the Source Preview feature is enabled, executes the program that is being previewed but does not download the rest of the source code for viewing or controlled execution. |
| Debug Previewed Source | When the Source Preview feature is enabled, triggers a full download of the program source code for normal debugging. If the program has compilation errors, the full compilation error listing is downloaded. |
| Toggle Init Exclude | Inverts the way Exclude mode operates so that it initially excludes code instead of initially including code (until an explicit directive). Same as toggleInitExclude command. |
| Cancel | Cancels the request being debugged; same as the Cancel button. Described further in Cancelling execution. |
| Turn Off Debugging | Stops a debugging session if it is a TN3270 Debugger session or if the TN3270 DEBUG command is being used for a web thread. Same as TN3270 DEBUG OFF command. |
