SirMon Subsystem Monitor menu: Difference between revisions
m reduce size of graphic |
m mention RKWeb equivalents |
||
| Line 1: | Line 1: | ||
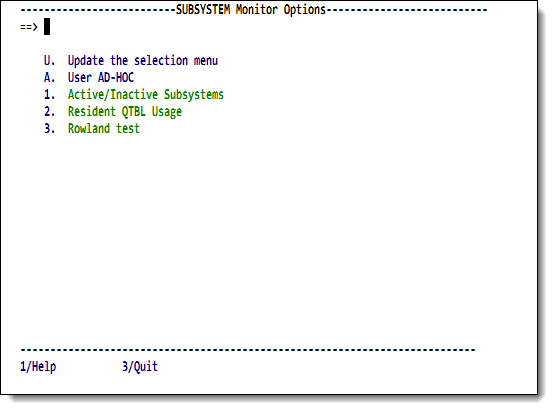
Option 5 from the 3270 <var class="product">SirMon</var> main menu presents a menu of subsystem statistics screens. | |||
Option 5 from the main menu presents a menu of subsystem statistics screens. | |||
This menu is also accessible by entering <code>=5</code> in the | This menu is also accessible by entering <code>=5</code> in the | ||
command line of any <var class="product">SirMon</var> screen. | command line of any <var class="product">SirMon</var> screen. In RKWeb, expanding the Performance > Subsystems menu of the Monitor activity displays these statistics options in a sub-menu. | ||
Selecting any option from | Selecting any option from the subsystem statistics menu brings you to a "scrollable" | ||
screen (see [[SirMon application structure#Scrollable screen format|Scrollable screen format]]) displaying specific statistics for all defined | screen (see [[SirMon application structure#Scrollable screen format|Scrollable screen format]]) displaying specific statistics for all defined or active subsystems in an Online system. | ||
or active subsystems in an Online system. | The PF1 key displays explanatory text for the given statistics. | ||
<p class="caption" style="width:475px">Subsystem Monitor menu</p> | <p class="caption" style="width:475px">Subsystem Monitor menu</p> | ||
Revision as of 01:39, 11 May 2017
Option 5 from the 3270 SirMon main menu presents a menu of subsystem statistics screens.
This menu is also accessible by entering =5 in the
command line of any SirMon screen. In RKWeb, expanding the Performance > Subsystems menu of the Monitor activity displays these statistics options in a sub-menu.
Selecting any option from the subsystem statistics menu brings you to a "scrollable" screen (see Scrollable screen format) displaying specific statistics for all defined or active subsystems in an Online system. The PF1 key displays explanatory text for the given statistics.
Subsystem Monitor menu
| 5.U Update the selection menu | Allows SirMon administrators to customize the Subsystem Monitor menu. |
|---|---|
| 5.A User AD-HOC | An adhoc view of subsystem statistics specific to each SirMon user. |
| 5.1 Active/Inactive Subsystems | Display of status, number of users, access (PRIVATE, PUBLIC, SEMIPUBLIC), non-precompiled prefix and precompiled prefix for all subsystems defined in the Online.
This is the only Subsystem Monitor screen from which subsystems may be STARTed or STOPped. |
| 5.2 Resident QTBL Usage | Detailed breakdown of key information about each subsystem's use of resident QTBL. |
As many as 30 locally defined screens may also be accessed from the Subsystem Monitor menu. These screens are defined by a SirMon administrator as described in SirMon custom screens.
The displayed list of subsystems can be limited with the following commands.
| FILE xxxxxxxx | Limits the display to subsystems that have the specified file open. Wildcards are not allowed in the file specification. |
|---|---|
| SUBSYS xxxxxxxx | Limits the display to subsystem names that match the specified wildcard string. For example, SUBSYS SIR* limits the display to only those subsystems that begin with the letters "SIR". |
| ALL | Removes any restrictions on the subsystem display. All subsystems are presented. |
All Subsystem Monitor screens give the option of zooming (the PF6 key) or obtaining a detail view (the PF10 key) on an individual subsystem. To determine the subsystem for which ZOOM or DETAIL statistics are required, the cursor must be on a valid 'subsystem' line.
- ZOOM presents a non-scrollable screen (refer to Non-scrollable screen format) of the same statistics as were presented on the original screen, but screen lines represent time-sliced views of the selected subsystem's performance.
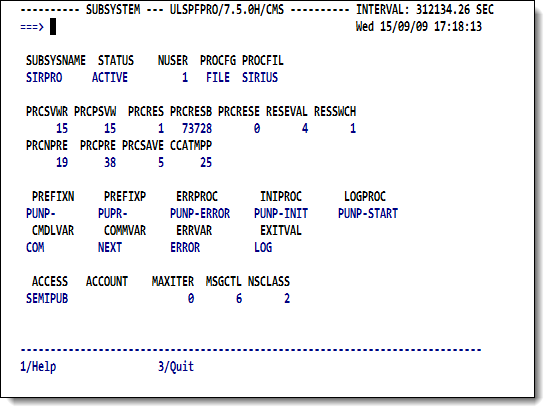
- DETAIL presents a display of most of the important statistics and information that can be displayed for any single subsystem:
Subsystem Detail screen
The PF3 key from a ZOOM or DETAIL screen returns the original Subsystem Monitor screen.
See also
- SirMon
- SirMon application structure
- SirMon main menu
- SirMon System Overview screen
- SirMon threshold setting
- SirMon background monitor
- SirMon System Monitor menu
- SirMon User Monitor menu
- SirMon File Monitor menu
- SirMon Subsystem Monitor menu
- SirMon Task Monitor menu
- SirMon Janus Monitor menu
- SirMon custom screens
- SirMon critical-file-resource monitoring
- SirMon user-initiated capturing of statistics
- System statistics displayed in SirMon
- User statistics displayed in SirMon
- File statistics displayed in SirMon
- Subsystem statistics displayed in SirMon
- Task statistics displayed in SirMon
- Critical File Resource statistics displayed in SirMon
- SirMon date processing

