SirMon System Monitor menu: Difference between revisions
Jump to navigation
Jump to search
m replace graphic |
mNo edit summary |
||
| Line 7: | Line 7: | ||
command line of any <var class="product">SirMon</var> screen. | command line of any <var class="product">SirMon</var> screen. | ||
Selecting | Selecting a numbered option from the menu brings you to a | ||
"non-scrollable" screen (see [[SirMon application structure#Non-scrollable screen format|Non-scrollable screen format]] that displays | "non-scrollable" screen (see [[SirMon application structure#Non-scrollable screen format|Non-scrollable screen format]] that displays | ||
a previously established set of statistics for the Online. | a previously-established set of statistics for the Online. | ||
The PF1 key displays definitions for the statistics | The PF1 key from such a screen displays definitions for the statistics reported in the screen. | ||
<p class="caption" style="width:475px">System Monitor menu</p> | <p class="caption" style="width:475px">System Monitor menu</p> | ||
| Line 27: | Line 26: | ||
<tr><th>Database I/O Performance</th> | <tr><th>Database I/O Performance</th> | ||
<td>Overall view of physical and logical I/O for the various | <td>Overall view of physical and logical I/O for the various database files defined to the Online environment.</td></tr> | ||
<tr><th>User State Distribution</th> | <tr><th>User State Distribution</th> | ||
<td> | <td>Reports the total number of users in the various categories of activity (running, waiting, swapping, etc.) at a given moment.</td></tr> | ||
<tr><th>User Wait Type Dist</th> | <tr><th>User Wait Type Dist</th> | ||
| Line 37: | Line 36: | ||
<tr><th>Request Profile</th> | <tr><th>Request Profile</th> | ||
<td>Overall view of | <td>Overall view of database activity up to the current moment. | ||
Displays total | Displays total <var>Find</var> statements and various measures of record access and update.</td></tr> | ||
<tr><th>MP Performance</th> | <tr><th>MP Performance</th> | ||
<td>Measures of performance specific to a multi-processor <var class="product">Model 204</var> environment.</td></tr> | <td>Measures of performance specific to a multi-processor <var class="product">Model 204</var> environment.</td></tr> | ||
<tr><th>Above-the-bar Buffers</th> | <tr><th>Above-the-bar Buffers</th> | ||
<td></td></tr> | <td></td></tr> | ||
<tr><th>Above/Below the bar disk I/O </th> | <tr><th nowrap>Above/Below the bar disk I/O </th> | ||
<td></td></tr> | <td></td></tr> | ||
| Line 53: | Line 52: | ||
</table> | </table> | ||
As many as 26 locally defined screens may also be accessed from the System | As many as 26 locally defined screens may also be accessed from the System Monitor menu. These screens are defined by a <var class="product">SirMon</var> administrator, as described in [[SirMon custom screens]]. | ||
Monitor menu. These screens are defined by a <var class="product">SirMon</var> administrator as described in [[SirMon custom screens]]. | |||
==See also== | ==See also== | ||
Revision as of 23:33, 2 November 2015
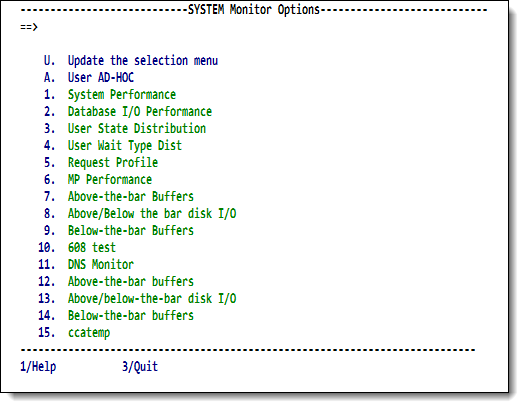
Option 2 from the SirMon main menu presents a menu of system statistics screens.
This menu is also accessible by entering =2 in the
command line of any SirMon screen.
Selecting a numbered option from the menu brings you to a "non-scrollable" screen (see Non-scrollable screen format that displays a previously-established set of statistics for the Online. The PF1 key from such a screen displays definitions for the statistics reported in the screen.
System Monitor menu
| Update the selection menu | Allows SirMon administrators to customize the System Monitor menu. |
|---|---|
| User AD-HOC | An adhoc view of system statistics specific to each SirMon user. |
| System Performance | General view of system performance that includes CPU usage, I/O activity and other broad measures. |
| Database I/O Performance | Overall view of physical and logical I/O for the various database files defined to the Online environment. |
| User State Distribution | Reports the total number of users in the various categories of activity (running, waiting, swapping, etc.) at a given moment. |
| User Wait Type Dist | Displays counts of users by wait type (waiting for disk I/O, or file resource, etc.). |
| Request Profile | Overall view of database activity up to the current moment. Displays total Find statements and various measures of record access and update. |
| MP Performance | Measures of performance specific to a multi-processor Model 204 environment. |
| Above-the-bar Buffers | |
| Above/Below the bar disk I/O | |
| Below-the-bar Buffers |
As many as 26 locally defined screens may also be accessed from the System Monitor menu. These screens are defined by a SirMon administrator, as described in SirMon custom screens.
See also
- SirMon
- SirMon application structure
- SirMon main menu
- SirMon System Overview screen
- SirMon threshold setting
- SirMon background monitor
- SirMon System Monitor menu
- SirMon User Monitor menu
- SirMon File Monitor menu
- SirMon Subsystem Monitor menu
- SirMon Task Monitor menu
- SirMon Janus Monitor menu
- SirMon custom screens
- SirMon critical-file-resource monitoring
- SirMon user-initiated capturing of statistics
- System statistics displayed in SirMon
- User statistics displayed in SirMon
- File statistics displayed in SirMon
- Subsystem statistics displayed in SirMon
- Task statistics displayed in SirMon
- Critical File Resource statistics displayed in SirMon
- SirMon date processing
