SirMon System Overview screen: Difference between revisions
m add graphic |
m 1 revision: SirMon pages |
(No difference)
| |
Revision as of 22:05, 10 September 2015
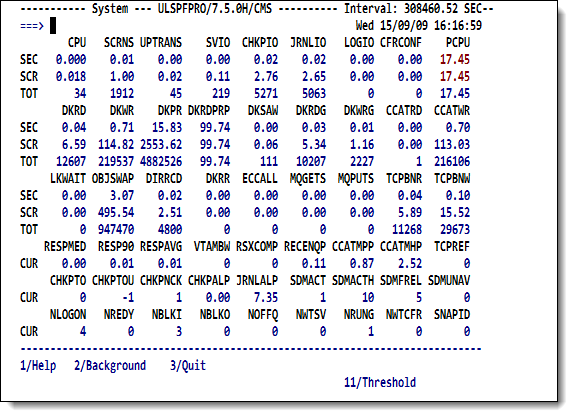
Option 1 from the SirMon main menu presents a formatted, pre-defined, system overview screen. This screen is useful in displaying the overall state of a running Online. This allows an Administrator to quickly determine if there are any problems in the system, and if so, to identify the areas needing further examination. This screen is also accessed via the PF10 key (DETAIL) from any System Monitor screen (see SirMon System Monitor menu).
System Overview screen
The values for any statistics that have exceeded pre-set limits are highlighted in order to draw attention to potential performance problems. These limits are set in a companion screen that is excessed via the PF11 key from the system overview screen. Currently PCPU is the only statistic that is highlighted when it drops below its threshold. Other statistics, such as response time indicators, are highlighted when their values rise above the threshold.
The threshold values may also be used to direct the SirMon "background monitor," described in SirMon background monitor. SirMon provides a default set of threshold values, which will require customization to consider the specifics of each installation.
See also
- SirMon
- SirMon application structure
- SirMon main menu
- SirMon System Overview screen
- SirMon threshold setting
- SirMon background monitor
- SirMon System Monitor menu
- SirMon User Monitor menu
- SirMon File Monitor menu
- SirMon Subsystem Monitor menu
- SirMon Task Monitor menu
- SirMon Janus Monitor menu
- SirMon custom screens
- SirMon critical-file-resource monitoring
- SirMon user-initiated capturing of statistics
- System statistics displayed in SirMon
- User statistics displayed in SirMon
- File statistics displayed in SirMon
- Subsystem statistics displayed in SirMon
- Task statistics displayed in SirMon
- Critical File Resource statistics displayed in SirMon
- SirMon date processing
