SirMon Task Monitor menu: Difference between revisions
mNo edit summary |
m 1 revision: SirMon pages |
(No difference)
| |
Revision as of 22:05, 10 September 2015
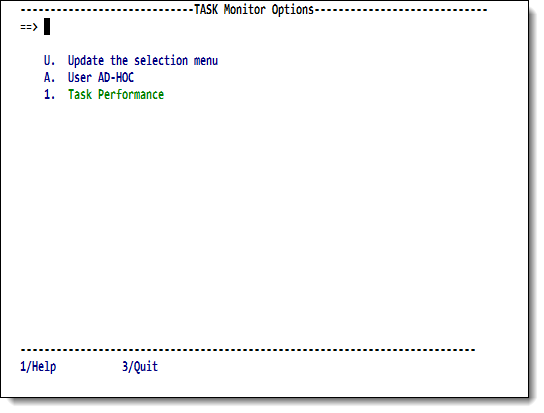
Option 6 from the main menu presents a menu of task statistics screens.
This menu is also accessible by entering =6 in the
command line of any SirMon screen.
Selecting any option from this menu transfers the user into a "scrollable"
screen (see Scrollable screen format) displaying specific statistics for all tasks
in an Online system.
If a site does not use the MP/204 feature of Model 204, then only information for "task 0" (the main task) is displayed.
The PF1 key displays definitions for the presented statistics.
Task Monitor menu
| 6.U Update the selection menu | Allows SirMon administrators to customize the Task Monitor menu. |
|---|---|
| 6.A User AD-HOC | An adhoc view of task statistics specific to each SirMon user. |
| 6.1 Task Performance | Display of CPU usage, the PCPU statistic, and other statistics related to performance of Model 204 multitasking. |
AS many as 31 locally defined screens may also be accessed from the Task Monitor menu. These screens are defined by a SirMon administrator, as described in SirMon custom screens.
All Task Monitor screens give the option of zooming (the PF6 key) on an individual task. The cursor must be on a valid "task" line to determine the task for which a ZOOM display is requested. ZOOM presents a non-scrollable screen (see Non-scrollable screen format) with the same statistics as were presented on the original screen, but screen lines represent time-sliced views of the selected task's performance.
There is no DETAIL data available in the Task Monitor. The PF3 key from a ZOOM screen returns the user to the original Task Monitor screen.
See also
- SirMon
- SirMon application structure
- SirMon main menu
- SirMon System Overview screen
- SirMon threshold setting
- SirMon background monitor
- SirMon System Monitor menu
- SirMon User Monitor menu
- SirMon File Monitor menu
- SirMon Subsystem Monitor menu
- SirMon Task Monitor menu
- SirMon Janus Monitor menu
- SirMon custom screens
- SirMon critical-file-resource monitoring
- SirMon user-initiated capturing of statistics
- System statistics displayed in SirMon
- User statistics displayed in SirMon
- File statistics displayed in SirMon
- Subsystem statistics displayed in SirMon
- Task statistics displayed in SirMon
- Critical File Resource statistics displayed in SirMon
- SirMon date processing
