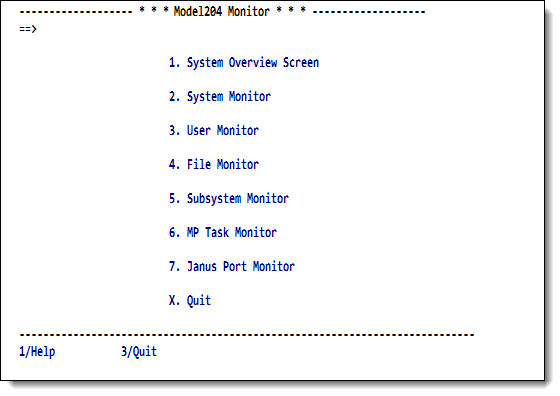
SirMon main menu
The SirMon main menu is the primary entry point into SirMon. The main menu is reached by any of the following ways:
- Entering the subsystem name
SIRMONat Model 204 command level. - Selecting the
Monitoroption from the UL/SPF main menu. - Typing
=in the command window of any SirMon screen. - Typing
=M.4in any UL/SPF screen.
SirMon main menu
The SirMon main menu options are described below:
| 1. System Overview Screen | Presents the major items of interest for measuring and determining the current condition of the active, online Model 204 region. This single panel, described further in SirMon System Overview screen, presents each statistic as a rate per second and per screen (where appropriate), and as a total.
Threshold setting (SirMon threshold setting) and background task definition and initialization (SirMon background monitor) are accessed from this screen. |
|---|---|
| 2. System Monitor | Presents a sub-menu of monitoring screens (see SirMon System Monitor menu) that are specific to the system's overall condition and performance. |
| 3. User Monitor | Presents a sub-menu of monitoring screens (see SirMon User Monitor menu) that show specific views of all users in the system. |
| 4. File Monitor | Presents a sub-menu of monitoring screens (see SirMon File Monitor menu) that show specific views of all open files in the system. |
| 5. Subsystem Monitor | Presents a sub-menu of monitoring screens (see SirMon Subsystem Monitor menu) that show specific views of subsystems defined to the system. The second option on this submenu provides information for both active and inactive subsystems. This includes a list of defined subsystems, their running status, number of active users, procedure prefixes and access type.
Subsystems may be started and stopped from this screen. |
| 6. MP Task Monitor | Presents a sub-menu of monitoring screens (see SirMon Task Monitor menu) that show specific views of all tasks in the system. If the MP/204 feature is not installed, the task monitor screens only display information for the maintask (task 0). |
Each of the sub-menus in 2-6 above allows up to 32 views of information within the statistics category. A small number of views come pre-formatted with SirMon:
- 7, for system statistics
- 8, for user statistics
- 6, for file statistics
- 2, for subsystem statistics
- 1, for task statistics
Users may define and save additional custom views, as described in SirMon custom screens.
In addition to system-wide custom views that appear on the menus for all
users, SirMon allows individual users to save a single "adhoc" view for each menu.
User adhocs are accessed as menu option A on each menu (so a user's
File adhoc is accessed as SIRMON 4.A), and each user's
view is unique to that user.
See also
- SirMon
- SirMon application structure
- SirMon main menu
- SirMon System Overview screen
- SirMon threshold setting
- SirMon background monitor
- SirMon System Monitor menu
- SirMon User Monitor menu
- SirMon File Monitor menu
- SirMon Subsystem Monitor menu
- SirMon Task Monitor menu
- SirMon Janus Monitor menu
- SirMon custom screens
- SirMon critical-file-resource monitoring
- SirMon user-initiated capturing of statistics
- System statistics displayed in SirMon
- User statistics displayed in SirMon
- File statistics displayed in SirMon
- Subsystem statistics displayed in SirMon
- Task statistics displayed in SirMon
- Critical File Resource statistics displayed in SirMon
- SirMon date processing
