Test the end to end configuration
Subsections follow for the Janus Debugger and for the TN3270 Debugger. It is assumed that the Debugger Client is up and running.
Janus Debugger
- Open the browser you just set up to use the Debugger as a proxy.
- Invoke the URL of a User Language-based page from your target Janus Web Server.
Note: If you normally use "https://%22 and not "http://%22 to begin the URL (that is, your Web Server is SSL-secured), and if you set up the debuggerConfig.xml file for SSL support, make sure that you use "http://" here now to access the secured web port.
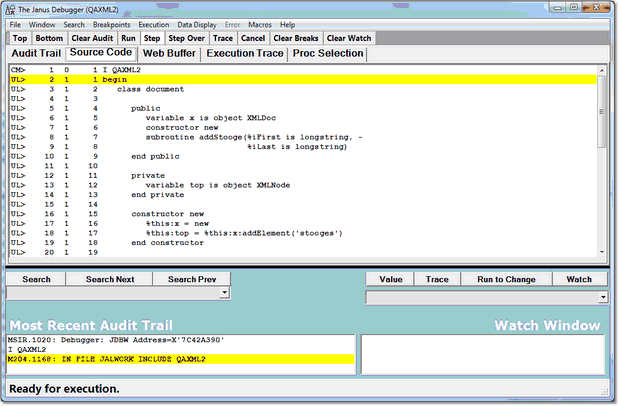
- The source code of the program should appear in the Source Code page of the Client with its procedure name displayed in the title bar, similar to the following Source Code display:
- If instead, you receive a Communication Error message that reports an "error while communicating with the remote host," you may have an error in the debuggerConfig.xml settings. If so, and you find the error, restart the Debugger Client and try the test URL again. For more information about error handling, see How the Janus Debugger handles communication breaks.
The Debugger Client is ready to use. From the Client GUI, you can control the execution of your web application's User Language code (see Getting Started).
For an archive of information about features that are new or enhanced in the latest version of the Debugger Client, see the Release Notes.
TN3270 Debugger
- 1. From the Model 204 command prompt or within a BATCH2 input stream, start a TN3270 Debugger session:
TN3270 DEBUG ON janClientPort pcHost pcPort workerPort
- where:
| janClientPort |
The name of the Janus client socket port that is defined for the TN3270 Debugger to use to contact the Debugger Client workstation. This port must be started. |
| pcHost | The workstation running the Debugger Client. This may be an IP number or a DNS name, as described earlier. |
| pcPort | The workstation port number on which the Debugger Client is listening. As described earlier, this is typically 8081. |
| workerPort | The port number in your Online that is defined for worker threads. This can be the same port number that provides worker threads for the Janus Debugger, as well. |
- For example:
>TN3270 DEBUG ON DEBCLIENT 198.242.244.234 8081 3226
- 2. Verify that you receive a message similar to:
*** MSIR.0915: Debugging is on; client is 198.242.244.234 port 8081,
sessionID: 00000069D812279
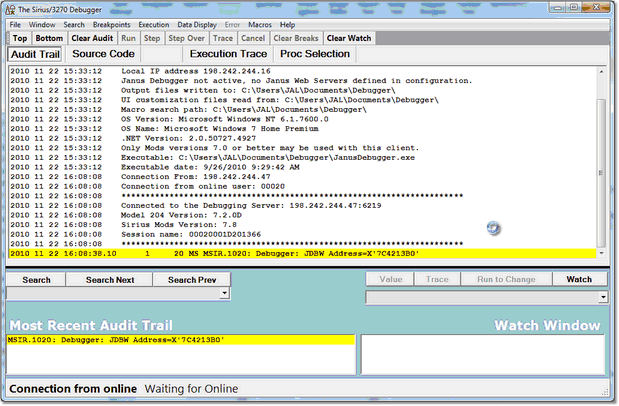
- 3. On the Debugger Client, verify that a "busy" cursor displays, as well as a Waiting for Online message in the Status bar:
- Additional Audit Trail page messages identify the Debugger Server's port and the address of its Online host, the user number assigned to the logged-in Model 204 user, as well as the Model 204 version.
- From this point on, any User Language program you initiate from the Model 204 command line will appear in the Source Code tab of the Debugger Client GUI for debugging, the procedure name will appear in the Client's title bar, and the "busy" cursor and Waiting for Online message will display between requests until your session ends.
- 4. Turn off the TN3270 Debugger by doing either of the following:
- From the Model 204 command prompt (or at the end of your BATCH2 stream), issue:
TN3270 DEBUG OFF
- You should receive this response in Model 204:
*** MSIR.0913: TN3270 Debugger is now off
- On the Debugger Client, Online has disconnected displays in the Status area.
- Log off of Model 204 (any logoff is an implied TN3270 DEBUG OFF).
- Note: Explicitly turning off the Debugger is necessary if you are using the Janus Debugger as well as the TN3270 Debugger for the same Online and worker port. To switch from a TN3270 Debugger session to a Janus Debugger session, you must explicitly drop the TN3270 Debugger session. The Janus Debugger automatically closes its connections and does not require an explicit notification to switch or end a session.
- 5. Reissue the command from step 1 to restart the Debugger Client, and the Debugger Client is ready to use.
- From the Client GUI, you can control the execution of your Model 204 application's User Language code (see Getting started).
- For an archive of information about features that are new or enhanced in the latest version of the Debugger Client, see the Release Notes.

