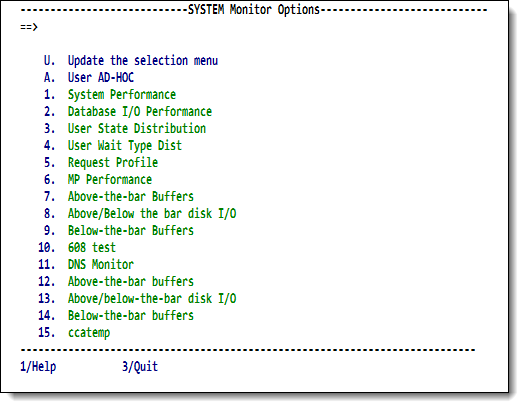
SirMon System Monitor menu
Option 2 from the SirMon main menu presents a menu of system statistics screens.
This menu is also accessible by entering =2 in the
command line of any SirMon screen.
Selecting any option from this menu brings you to a "non-scrollable" screen (see Non-scrollable screen format that displays a previously established set of statistics for the Online. the PF1 key displays definitions for the statistics contained in the current set.
System Monitor menu
| 2.U Update the selection menu | Allows SirMon administrators to customize the System Monitor menu. |
|---|---|
| 2.A User AD-HOC | An adhoc view of system statistics specific to each SirMon user. |
| 2.1 System Performance | General view of system performance that includes CPU usage, I/O activity and other broad measures. |
| 2.2 Database I/O Performance | Overall view of physical and logical I/O for the various data base files defined to the online environment. |
| 2.3 User State Distribution | Measures the total number of users in the various categories of activity (running, waiting, swapping, etc.) at a given moment. |
| 2.4 User Wait Type Dist | Displays counts of users by wait type (waiting for disk I/O, or file resource, etc.). |
| 2.5 Request Profile | Overall view of data base activity up to the current moment. Displays total FINDs, and various measures of record access and update. |
| 2.6 MP Performance | Measures of performance specific to a multi-processor Model 204 environment. |
As many as 26 locally defined screens may also be accessed from the System Monitor menu. These screens are defined by a SirMon administrator as described in SirMon custom screens.
See also
- SirMon
- SirMon application structure
- SirMon main menu
- SirMon System Overview screen
- SirMon threshold setting
- SirMon background monitor
- SirMon System Monitor menu
- SirMon User Monitor menu
- SirMon File Monitor menu
- SirMon Subsystem Monitor menu
- SirMon Task Monitor menu
- SirMon Janus Monitor menu
- SirMon custom screens
- SirMon critical-file-resource monitoring
- SirMon user-initiated capturing of statistics
- System statistics displayed in SirMon
- User statistics displayed in SirMon
- File statistics displayed in SirMon
- Subsystem statistics displayed in SirMon
- Task statistics displayed in SirMon
- Critical File Resource statistics displayed in SirMon
- SirMon date processing
