Breaking after READ SCREEN or READ MENU statements
Normally, the Debugger Client for the TN3270 Debugger pauses at a READ SCREEN or READ MENU statement (displaying a Full Screen Read Pending message in the Status bar), waiting for input from the Online user. Once you complete the input, the Client evaluates your response, displays a READ SCREEN Completed message in the Status bar, and continues (without pause, by default) processing statements until it reaches a breakpoint or the end of the request.
These events are reported in a sequence of lines in the Client Audit Trail page like the following:
... 10:01:48.27 2 20 LI I SCREENO ... 10:01:48.27 2 20 MS M204.1168: IN FILE GWDEB INCLUDE SCREENO ... 10:02:10 Full Screen Read Pending ... 10:02:22 READ SCREEN completed
If you want to examine how the program handles the user response to the READ SCREEN or READ MENU, for example, you can do either of the following:
- Explicitly Setting a single breakpoint after the READ SCREEN or READ MENU statement.
- Have processing automatically paused by default after the user interaction following READ SCREEN or READ MENU.
To invoke the second of the preceding options:
- In the Client, select Preferences from the File menu (or use the CTRL-P keyboard shortcut).
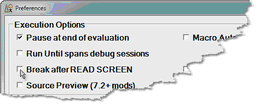
- In the Preferences dialog box, select the Break after READ SCREEN checkbox (it is clear by default), then click Done :
- After the Online user replies to the next READ SCREEN or READ MENU statement, the Debugger will pause at the statement following the READ SCREEN or READ MENU, and READ SCREEN completed will display in the Status bar.
- Running without a break after replying to READ SCREEN or READ MENU can be restored at any time by clearing the Break after READ SCREEN checkbox.
Note: The Client setPreference command has an option that lets you toggle the Break after READ SCREEN checkbox.
The Break after READ SCREEN setting that exists at the end of the Debugger Client session persists to the next run of the Client.
Note: As a convenience, the Debugger can bring your 3270 Emulator application to the top on your PC screen when the Client pauses for the READ SCREEN or READ MENU.
- To invoke this feature:
- Select Preferences from the File menu (or use the CTRL-P keyboard shortcut).
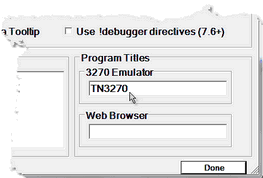
- In the Preferences dialog box, locate the 3270 Emulator text box (in the Program Titles section) and provide a text string that matches some or all of the title that displays at the top of the emulator window.
- The characters in your matching string can be any case and match anywhere in the title. Any trailing blanks you enter are preserved.
- Note: If you are working with READ SCREEN or READ MENU in a Web Legacy application, your browser is the tool with which you respond. Therefore, to have the Debugger pop up your browser window when the Client pauses for READ SCREEN or READ MENU, provide a browser name matching string in the Web Browser text box instead of in the 3270 Emulator text box.
- 3. Click Done.
- The feature takes effect at the next execution of a READ SCREEN or READ MENU. The 3270 Emulator (or Web Browser) setting that exists at the end of the Client session persists to the next run of the Client.
- Note: By default, this feature does not take effect if the Client is not debugging the part of a program that contains the READ SCREEN or READ MENU. For example, these statements might be in code selected to be excluded from debugging.
- However, if in addition to a Program Titles value you also select the Windows When Suspended option in the Preferences dialog box (Execution Options section), the feature will apply whenever these statements occur, even in code the Debugger is not actively executing. This will apply whether or not you have selected the Break after READ SCREEN checkbox.


