Debugging the TN3270 Debugger
Jump to navigation
Jump to search
Whenever you invoke a User Language program from an Online that has been configured for debugging, this sequence of events unfolds:
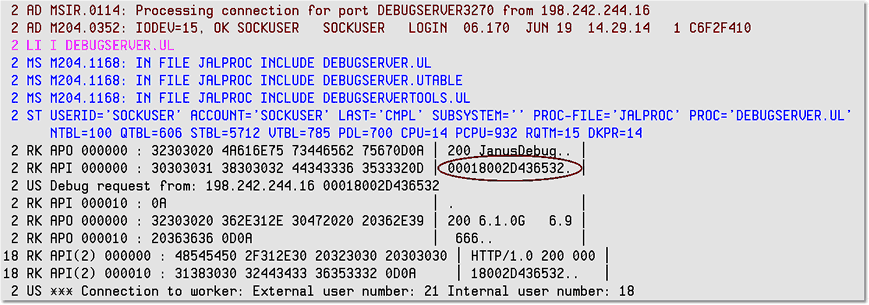
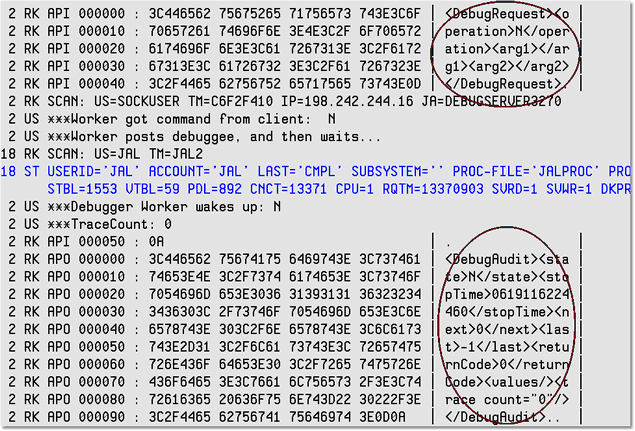
- 1. The initial user call to start the TN3270 Debugger (SIRDEBUG ON DEBCLI1 198.242.244.16 8081 3270 in the SirScan example lines below, which is described as part of the product installation) triggers a socket connection request from the issuing user's thread (using the CLSOCK port defined during installation) to the workstation that hosts the Debugger Client. The connection request (trace lines for which are circled below) contains the number of the Debugger Server port (configured during installation) and the user thread number.
- 2. Once the connection succeeds, the Debugger Client, in turn, connects to that Debugger Server port, which starts a SirScan thread whose default user ID is SOCKUSER (see top two SirScan lines, below). The Debugger Server communicates over a socket connection with the Client and creates a worker thread for this debugging session. The connection handshake contains a unique ID from the Client for this debugging session (circled, below). The Server worker thread uses AUDIT statements to report its activities to the SirScan audit trail.
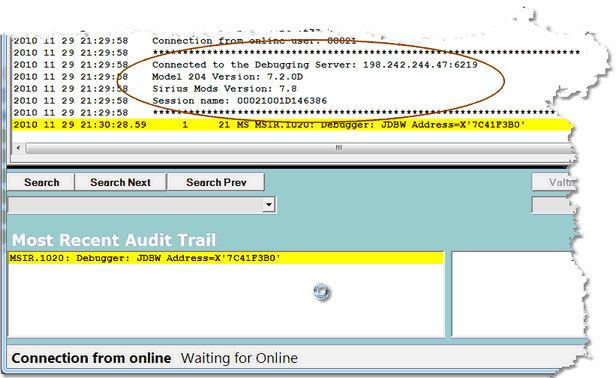
- The worker thread reports its actions in lines that begin with three asterisks (***). The worker refers to the Online thread to be debugged as the "debuggee." A successful connection between the Debugger Server and Debugger Client results in a "Debugging is on" message, and the ID referred to in the connection handshake becomes the "session ID" for this debugging session:
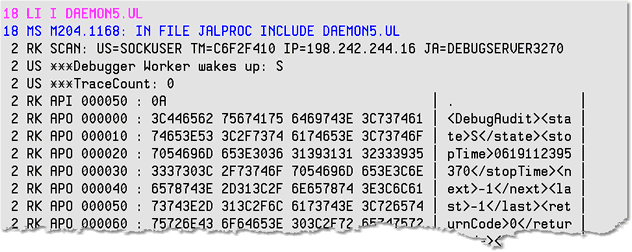
- 3. The worker thread is directed by the Debugger Client (based on user interface actions), and the worker thread maintains an internal master/slave, post/wait relationship with the Online thread that is being debugged. The initial action of the worker thread is to announce itself to the Debugger Client in the Audit Trail page:
- 4. The worker then waits for the Online thread to initiate debuggable activity. If you include a SirScan procedure from the Online thread, for example (DAEMON5.UL in the SirScan excerpt below), the worker detects this and pauses procedure processing while it sends the code lines to the Client (in an XML document) using the DEBCLI1 CLSOCK port, then waits for a response from the Client.
Note: The format of the XML messages in the following and subsequent code examples in this section is unpublished and subject to change.
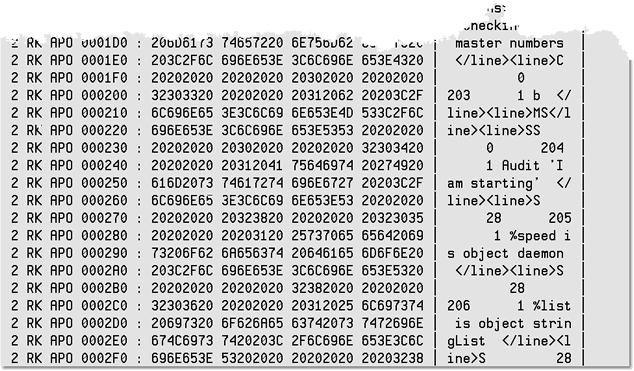
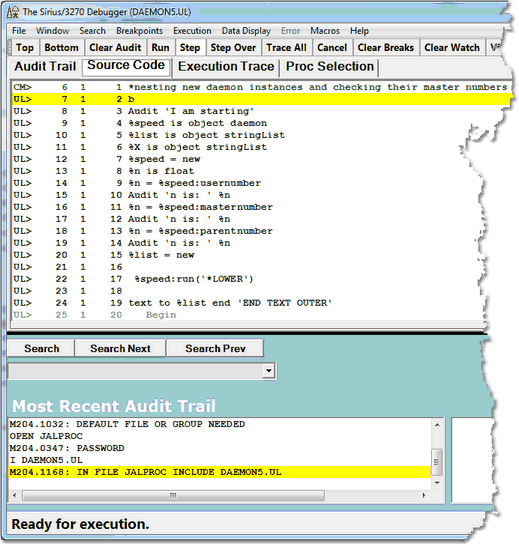
- 5. The Client displays the procedure code in the Debugger Source Code page:
- 6. The Client user initiates the next round of activity by invoking an operation on the source code, say, stepping to the next statement. The Client sends this command in an XML message to the worker (upper circle, below), and the worker wakes up and instructs the Online thread. The worker reports a sequence of "***" audit lines (the ending N's below mean "run to Next statement" and "Next statement executed"), then sends an XML response to the Client (lower circle, below) about the result of executing the next statement in the program:
- 7. The Client-worker-Online communication continues in this fashion according to the commands invoked by the Client GUI user. The worker continues in a loop/dialogue with the Client, reporting its state and latest activity to the Client, and receiving XML requests from the Client (commands that are based on what the Debugger GUI user is invoking). The worker also maintains a master-slave relationship with the Online thread, guiding the execution of the program and reporting execution results.
- 8. In case you need to debug the Debugger, you can access the XML traffic exchanged between the worker and Debugger Client. To do so, use the JANUS TRACE command (described in the Janus TCP/IP Base Reference Manual) to increase the tracing on the Debugger Server port (in this example, DEBUGSERVER3270) and on the Online's client socket port (in this example, DEBCLI1), and use SirScan to view the traffic. The JANUS DISPLAYTRACE command reveals the current trace values.
- Since a high tracing value, say 15, can capture huge amounts of data, remember to return the tracing settings to their former values when you no longer need so much detail.
- Also of possible use in a debugging situation, the Debugger Client installation folder is the default location for a text log (log.txt) of Client activity and reference file information.

