The tabbed pages
An important part of the user interface to the Janus Debugger or the TN3270 Debugger is the set of tabbed pages that use the main display window below them (the Web Buffer tab is not present for TN3270 Debugger sessions; Daemon tabs display dynamically if the program invokes daemons):
These pages are resizable by mouse if you grab and drag the black border bar at the bottom of the main window.
The pages are copyable:
- If you press the CTRL-C keyboard key combination or select the Copy option from the Window menu, the contents of the active (topmost) page are copied to the Windows clipboard. The number of lines copied is displayed in the Status bar. Only the Proc Selection page is not copyable.
- If you map the viewText command to a Client button or hot key, or select its equivalent from the Window menu, you can invoke a text viewer that lets you copy, edit, print, and save text data from Client pages.
Some of the pages are displayable in windows outside of the Client. These external windows are easily invoked by double clicking their tabbed page name, by selection from the Client's Window menu, or by mappable command.
Audit Trail tab
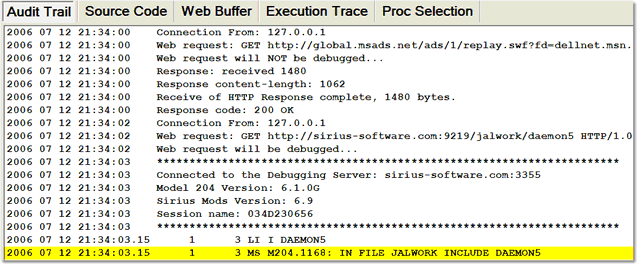
The Audit Trail page displays, from the beginning of the debugging session:
- The Model 204 audit trail lines produced by the online thread that is servicing web requests from your browser(s) or by the thread that is servicing your 3270/Batch2 requests
- The Model 204 audit trail lines produced by any threads that run daemons on behalf of your web or 3270/Batch2 requests
- Information about the state of the Debugger Client, such as the port on which it is listening and the port whose web server requests it is debugging
- All outgoing HTTP messages sent by your browser (passed through by the Janus Debugger)
The Most Recent Audit Trail window also and only displays audit trail lines.
The Audit Trail page is displayable separate from the Client in an external window.
Source Code tab
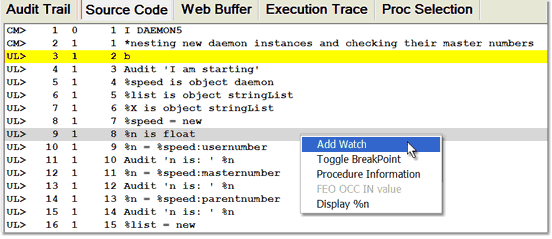
The Source Code page displays the source code lines of the User Language request that is currently being debugged. Here is where most of your interactions with program code take place: setting breakpoints, viewing the current execution position, getting detailed information about a source code line, watching variables from a selected source code line.
The page display format is:
| Column 1 |
Line type: CM> — command |
| Column 2 | Simple line number |
| Column 3 | Include level |
| Column 4 | Line number within include |
Web Buffer tab
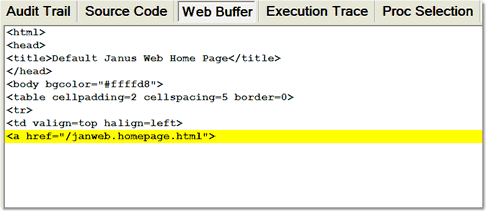
Not ordinarily present for TN3270 Debugger sessions, the Web Buffer page displays the lines the Janus Web Server application is preparing to send to the browser at the completion of the request. The page is updated in real time, each time you break execution, as you step through a code program and PRINT and HTML statements are executed. The most recent lines added to the page are highlighted, and you can watch your output HTML being built.
Top, Bottom, and search buttons are available. The page is cleared when a new request is initiated or if you clear it manually (via the Window > Clear Web Buffer button or the clearWebBuffer command).
The Web Buffer page is displayable separate from the Client in an external window.
Execution Trace tab
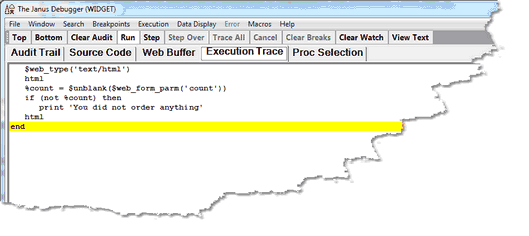
The Execution Trace page displays the output of the various tracing operations. It is discussed further in Tracing program execution.
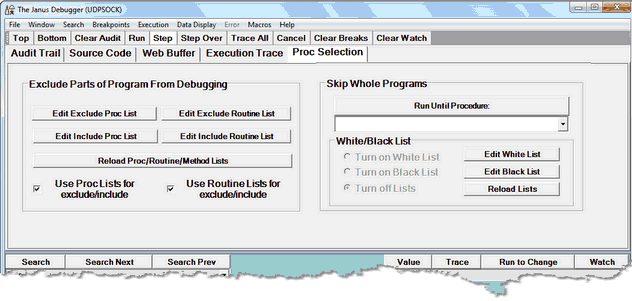
Proc Selection tab
The Proc Selection page lets you designate some sections of your program or entire programs, for debugging while omitting others. This may be for reasons of time or space economy. You can execute but not display in the Debugger Client specified sections of your code, ranging from a few lines to whole routines or inner or outer procedures.
The Exclude Parts of Program from Debugging section lets you specify multiple User Language methods, subroutines, or inner procedures whose source code will be executed but not shown in the Debugger Client. From this excluded source code, you can also specify methods, subroutines, or inner procedures whose code you want to be able to view.
The Skip Whole Programs section of the page lets you specify by name or name pattern only the outer procedures you want to debug. Those procedures not identified are executed but their code is not sent to or displayed in the Client. You can identify the procedures directly (by explicitly specifying them by name or pattern in a "white list") or indirectly (by explicitly excluding the procedures you do not want to debug by specifying them by name or pattern in a "black list").
The Proc Selection page options are discussed further in Excluding sections of source code from debugging.
See Also

