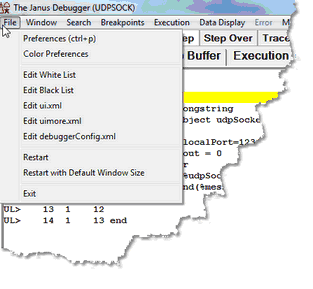
The File menu options are identified below:

Preferences
|
Also accessible (by default) by using the CTRL-P keyboard shortcut, this option opens a dialog box that lets you control certain Debugger Client operating options:
Execution Options
* Pause at end of evaluation
- Whether to pause at the end of the evaluation of a request (to review program data as it is at the end of request processing) before sending any contents of the web output buffer or any 3270/Batch2 terminal output.
- Run Until spans debug sessions
- Whether Client "Run Until" processing should continue searching until it finds a specified procedure, even if the program contains HTML frames, the debugging session is interrupted by a loss of the connection to the Model 204 Online, or the TN3270 Debugger is toggled off and on again.
- Whether the TN3270 Debugger automatically breaks execution after READ SCREEN or READ MENU statements (see Breaking at the end of READ SCREEN or READ MENU statements).
- Whether the Client should initially display only a preview of the entire source code program (for programs with at least 1000 lines, by default).
- Whether an include of a procedure from command level will automatically invoke a macro whose name matches the name of the included procedure.
Displays the 3270 Emulator window or browser window for code not being debugged
|
IE Options:
*IE Mode
- Whether the Client should automatically configure and maintain proxy server settings for the Internet Explorer, and whether the proxy is for all host URLs or only for a specified few.
- Same as the setIEMode command.
- Whether the Client's browser maintenance should clear and preserve any exception URLs designated in Internet Explorer to bypass the Client as proxy server.
- Use existing proxy on not debugged URLs
- Whether the Client should reroute exception URLs (designated in Internet Explorer to bypass the proxy server) to a preexisting proxy server rather than directly to the Internet.
|
Display Options:
* Show at most <x> list items
- What the display maximum is for the number of $list, Stringlist, or Arraylist object items whose values you can view in a separate Value window.
- Restore watches on startup<
- Whether to restore this session's remaining Watch Window contents when the Client starts its next session.
- Trim blanks from selection in View Text
- Whether leading and trailing blanks should be trimmed from selections you copy to the Text Viewer.
- History to Execution Trace
- Whether execution history data should display in the Execution Trace page instead of a separate window.
- Show long watch values in a Tooltip
Whether to display in a tooltip box Watch Window items that are too wide to fit within the Watch Window.
- Whether to enable Debugger directives, which let you exclude designated source code from the debugging session.
|
Web Server Selection:
| * Which of the Onlines specified in the Client configuration file (debuggerconfig.xml) are to have their web requests debugged. For more information, see Debugging multiple Web Servers.
|
Program Titles:
* 3270 Emulator, Web Browser
- Whether to bring to the top of the screen (when the Client pauses for user to provide input) the 3270 or browser window whose title is matched by the text specified in the corresponding box.
|
Main Button Bar:
* Top, Center, or Bottom
- Whether to change the position of the main (non-external) button bar from its default (Top), above the main window) to either just below the main window (Center), or to the very bottom of the Client window (Bottom).
- Whether extra buttons defined in the ui.xml file should be added to the display of the main button bar (wherever it is located). If the checkbox is cleared, they display in a separate external window when invoked by menu or command.
- Same as the extraButtonBar command with the argument main.
|
Main Window Options
* Hide Lower Section
- Whether to hide the lower section of the main window (everything below the tabs). This is useful in a multiple monitor environment where the Audit Trail and Watch Window are in separate windows on another monitor.
- Same as the hideLower command.
|
|
Color Preferences
|
Lets you change the color of text and highlighting in the various Client windows and pages.
|
Edit White List
|
Lets you create or edit an existing whitelist.txt file. This file contains a list of the Model 204 procedures that you want to debug.
When white listing is activated and the Debugger runs your source code, it filters procedures automatically, stopping to interactively debug only the requests that are on the white list. Other procedures execute normally, but they are not interactively debugged.
|
Edit Black List
|
Lets you create or edit an existing blacklist.txt file. This file contains a list of the Model 204 procedures that you want 'not' to debug.
When black listing is activated and the Debugger runs your source code, it filters procedures automatically, stopping to interactively debug only the requests that are not on the black list. Other procedures execute normally, but they are not interactively debugged.
|
Edit ui.xml
|
Lets you create or edit an existing ui.xml file. This file specifies modifications to the Client's default operational buttons and keyboard shortcuts. You can set the buttons to perform actions (commands), or you can set hot keys to commands.
|
Edit uimore.xml
|
Lets you create or edit an existing uimore.xml file. This file provides the same kind of functionality as, but entirely overrides the ui.xml file.
|
Edit debuggerConfig.xml
|
Opens the debuggerConfig.xml file for viewing and editing its elements (which define Online connection parameters, filetype filtering, and local editors, among other things).
|
Restart
|
Restarts the Debugger Client. Same as the restart command.
|
Restart with Default Window Size
|
Restarts the Debugger Client with the default size (as when initially installed) for the main window instead of the size at last exit.
Same as the [restartDefault command|restartDefault]] command.
|
Exit
|
Does no further processing and immediately closes the Client.
|
